
Professionals in the Contingent Workforce
2016 Fact Sheet
This fact sheet examines the segment of the professional workforce engaged in contingent or alternative work arrangements, referred to collectively as contingent work. In 2015, there were over 9.2 million self-employed and temporary workers employed in management, professional, and related occupations according to data from the Census Bureau. Special attention will be paid to arts, design, entertainment, sports, and media occupations where over 30 percent of the workforce is self-employed. The fact sheet will also examine issues facing adjunct faculty as well as assess the challenges facing the contingent workforce.
The absence of specific government data on the contingent workforce is a significant limitation when researching the professional contingent workforce. The U.S. Census Bureau, through the Current Population Survey (CPS), released a regular supplemental survey on the contingent workforce, but the supplement was discontinued in 2005. To evaluate the contingent workforce, this fact sheet relies on CPS self-employment data, non-governmental surveys of the independent workforce, the CPS contingent workforce supplements, and industry employment data.
Defining the Contingent Workforce
A standard work arrangement is one in which a person works full-time or part-time for one employer for an indefinite period of time. Contingent workers are employed in non-permanent positions as independent contractors, temporary workers, contract workers, on-call workers, consultants, freelancers, or are self-employed. The U.S. Bureau of Labor Statistics (BLS) defines contingent work as work where no implicit or explicit agreement exists for the work to continue, typically beyond one year. However, the CPS contingent worker supplement was the last survey that tracked work by its duration. Thus, this fact sheet focuses on non-permanent employment without regard to duration.
The contingent workforce includes:
1. Self-Employed and Independent Contractors
The distinction between a person who is self-employed and one that is an independent contractor can be confusing. Generally, if a person is an independent contractor, then they are self-employed, but an independent contractor is not always self-employed.[1] For example, a graphic designer that works from her home and designs reports and publications for companies is an independent contractor and self-employed. But a doctor who examines a patient is self-employed and not an independent contractor
2. Temporary (or Temp) Workers
Temp workers are employed, and paid, by a temporary help services agency that assigns them to employers upon request. The temporary help services industry falls within the employment services industry and accounts for a majority (80 percent) of the employment services industry. Detailed data is available for the employment services industry, but only workforce totals are available for the temporary help services industry.
3. On-Call Workers
Employed on an on-call basis, these workers report to work when needed. The CPS contingent worker survey tracked these workers until the survey was discontinued in 2005. There is no known survey that currently tracks on-call workers. However, U.S. Secretary of Labor Tom Perez announced in January 2016 that the contingent worker survey would be reinstated and expected release of new data in May 2017.
4. Contracted Employment (Workers Provided by Contract Firms)
Contracted employment describes workers who are employed by an employer that contracts out the employee’s services to another employer. These workers usually work at a job site that is not the location of the principle employer. The CPS survey tracked these workers until the survey was discontinued in 2005.
5. Short-Term Contract Workers
Many workers are employed directly by the employer, but under a short or long-term contract. Thus, employment is set to end on a specific date, or after the terms of the contract are fulfilled. Since there is no available data to quantify this segment of the contingent workforce, the fact sheet will discuss the example of adjunct faculty.
The Changing Contingent Workforce
Capturing a complete picture of the alternative workforce is challenging since the discontinuation of the CPS contingent worker survey. However, good data exists on self-employed and temp workers. In the case of self-employed workers, the contingent worker survey took steps that this fact sheet does not to exclude self-employed workers who were business operators. This fact sheet will review the 2005 data on workers provided by contract firms as well as on-call workers. Finally, the case of adjunct faculty will be explored to highlight the increased use of short-term contract workers.
The Self-Employed Workforce
In 2015, there were just over 15.4 million workers in the U.S. who reported being self-employed in their main job; 46 percent of them worked in management, professional, and related occupations (7.2 million self-employed professional workers). Overall, 12 percent of the management, professional, and related U.S. workforce was self-employed in 2015. Another nearly 342,631 workers reported being self-employed in a second job; 50 percent were self-employed in management, professional, or related occupations.
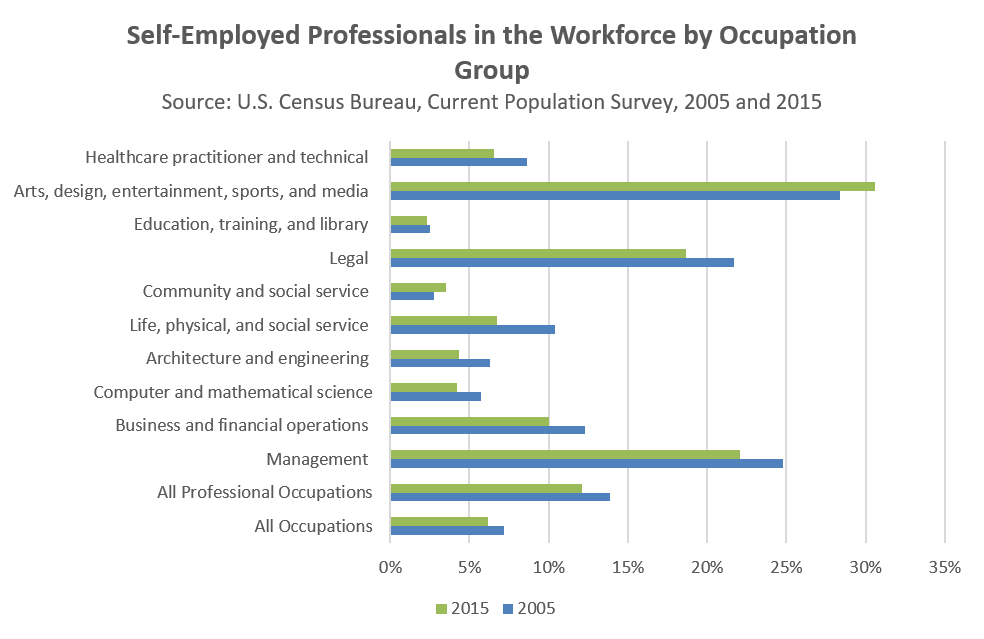
Among the management, professional, and related occupational groupings[a], three had a concentration of self-employed workers that was well above the national average: management occupations[b] (22 percent self-employed); legal occupations[c] (19 percent); and arts, design, entertainment, sports, and media occupations (31 percent self-employed). All other management, professional, and related occupation groups had a concentration of self-employed workers that was between two and 10 percent.
The self-employed professional and technical workforce declined by four percent between 2005 and 2015. At the same time, employees (all those not self-employed) in the professional and technical workforce grew by 20 percent.[2] The number of professionals who were self-employed and incorporated increased by nearly 300,000. Self-employed professionals who were unincorporated declined by nearly 100,000. Only arts and media and community and social service professionals who were self-employed and unincorporated saw an increase in employment.
Self-Employment in Arts, Design, Entertainment, Sports, and Media Occupations
The arts, design, entertainment, sports, and media (arts and media) occupation group includes designers, athletes, musicians, announcers, news analysts, and photographers among others. There are 18 occupations in the broad arts and media occupational category and 12 of those occupations saw an increase in the concentration of self-employed workers from 2005 to 2015.[3]
From 2005 to 2015, among all workers in arts and media occupations, employment grew by 11 percent. Self-employment in arts and media occupations grew by 17 percent during the same period. The concentration of self-employed workers in all arts and media occupations grew from 28 percent in 2005 to 31 percent in 2015. However, 12 out of the 18 arts and media occupations saw increases between one and 14 percent in the concentration of self-employed workers in the particular occupation.[4]
The demographics of the self-employed arts and media workforce shows that they are older than traditional arts and media workers, majority male and well educated.
The arts and media self-employed workforce, in July 2016, averaged 48 years of age; workers who were not self-employed in the traditional arts and media workforce averaged 38 years of age. The average age among all workers in arts and media occupations was 41.[5]
The arts and media workforce was 47 percent female in July 2016. A nearly equal percentage of women were self-employed in the arts and media workforce.[6]
Self-employed workers in arts and media occupations had slightly higher education attainment than workers who were not self-employed in arts and media occupations. Among the non-self-employed, 59 percent had a bachelor’s degree or higher and among self-employed workers, 64 percent had earned a bachelor’s degree or higher by July 2016.[7]
On average, 31 percent of the arts and media workforce was self-employed. Two out of the four regions in the U.S. had a higher concentration of self-employed workers, including the West (34 percent) and the Northeast (32 percent self-employment).[8]
No research exists to explain the growth of self-employment in arts and media occupations. Multiple explanations are possible. Since the self-employed arts and media workforce is older than traditional arts and media workers, these older workers may be seeking freedom from the traditional 9 to 5 schedule and seek out self-employment by choice.
Alternatively, employers could be driving the growth of the self-employed workforce by awarding more work to independent contractors in an effort to save money. As discussed below, employers can save 20-40 percent by hiring an independent contractor instead of a traditional employee. In fact, even though self-employed workers in arts and media occupations are older and more educated than traditional workers and should be earning more money, in 2014, average earnings for a self-employed worker in an arts and media occupation was $45,533, compared to $47,365 for non-self-employed arts and media workers.[9] If cost savings are the driving force behind the shift, then it may be difficult for employers to access a skilled workforce because the lower pay may drive experienced workers out of the field and deter new workers from entering the field.
Temporary Workers
According to BLS, the temporary help services industry employed 2,891,400 workers in May 2016.[10] The temp industry grew by 40 percent between May 2010 and May 2016, adding nearly 830,000 jobs. This growth accounted for six percent of all job growth in the U.S. from May 2010 to May 2016.[11]
Temporary help workers are paid by a temp agency, but perform work at an employer’s worksite. The flexible nature of these working arrangements has meant that many workers are hired when the U.S. economy is expanding, but steep job losses result during economic contraction.[12]
The temporary help services industry grew nine percent between 2006 and 2016.[13] However, as noted above, the industry is susceptible to sharp downturns. For example, from 2007 to 2009, employment in temporary help services declined by nearly 780,000 jobs or 30 percent.[14]

The temporary help services industry falls within the employment services industry. Temporary help services accounted for about 80.3 percent of employment within the employment services industry in 2015. Professional and technical workers made up 18 percent (about 672,000 workers) of the employment services industry workforce. The professional and technical occupation group with the greatest number of workers was business and financial occupations with 164,270 employed in 2015.

Substitute teachers (48,010) made up the majority of education, training, and library workers in the employment services industry in 2015. Human resources specialists accounted for 52 percent of all business and financial operations occupations in 2015. Within healthcare practitioner and technical occupations in 2015, most workers in the employment services industry were nurses (48,070 RNs and 27,595 LPNs).[15]
Recent research and media reports have raised concerns about temporary workers in healthcare occupations. A 2011 Johns Hopkins Medicine study found that “Temporary staff members working in a hospital’s fast-paced emergency department are twice as likely as permanent employees to be involved in medication errors that harm patients.” While temporary healthcare workers, like doctors and nurses, are considered a cheap alternative to permanent staff, the study concluded that there is great risk to patient safety.[16]
An investigation by ProPublica and the Los Angeles Times in 2009 “found dozens of instances in which staffing agencies skimped on background checks or ignored warnings from hospitals about sub-par nurses on their payrolls. Some hired nurses sight unseen, without even conducting an interview. As a result, fill-in nurses with documented histories of poor care have fallen asleep on the job, failed to perform critical tests or stolen drugs intended to ease patients’ pain or anxiety.”[17] These troubling reports of abuse could explain why there has been a decline in employment of temporary healthcare workers in the last 10 years.
On-Call Workers
In February 2005, the last year a survey of on-call workers was conducted, there were 2,453,623 on-call workers in the U.S. Professional and technical on-call workers were 36 percent of the on-call workforce. Nearly 45 percent (388,360) worked in education, training, and library occupations. Another 21 percent of on-call workers worked in healthcare practitioner and technical occupations.[18]
Because the contingent workers survey was discontinued, it is difficult to estimate the size of the on-call workforce after 2005. A 2015 study, which conducted a version of the contingent worker survey, estimated the on-call workforce to be 2.6 percent of employed persons in 2015 or about 3,884,400 workers.[19]
Workers Provided by Contract Companies
In February 2005, there were 813,000 workers provided by contract firms. Nearly 40 percent were in management, professional, and related occupations. Most were employed in the education and health services industry.[20] The 2015 survey estimated that 3.1 percent of workers were provided by contract firms. This amounted to about 4,631,400 workers in the 2015 period of study.[21]
Adjunct Faculty in the Contingent Workforce
Contingent employment has long been on the rise among adjunct faculty in American colleges and universities. Estimates placed the size of the adjunct workforce at 1.4 million in the fall of 2011, or about 76 percent of all instructional staff.[22] Many adjuncts are employees of the college or university, but on a short-term or contract basis. Adjuncts may have an implied or explicit contract to teach one or more semesters for a college or university, but the adjunct has little job security and most lack access to retirement or health benefits.[23]
Historically, full-time tenure or tenure-track faculty made up a large percentage of college and university faculty. This faculty was well paid, had access to pension and health benefits, and had the academic freedom to apply rigor in the classroom. Typically, full-time faculty teach two to six courses per year.[24] In 1975, 45 percent of college and university teachers were full-time tenured or tenure-track faculty.[25] In 2013, just 27 percent were full-time tenured or tenure track and 73 percent of postsecondary faculty were ineligible for tenure by 2013.[26]
Most part-time faculty want full-time work. A June 2012 survey of part-time adjunct faculty found that nearly 75 percent of respondents were looking for full-time tenure-track positions or would accept a full-time tenure-track position with their current college or university employer.[27] While the cohort was characterized as “part-time faculty,” nearly 30 percent of respondents reported teaching three or more courses in a semester.[28]
Most of the surveyed part-time contingent faculty had earned at least a master’s degree (40 percent) and 30 percent reported earning a doctorate, yet part-time faculty compensation is not commensurate with experience and education. Among respondents of the part-time faculty survey, the median pay per course was $2,700. Part-time faculty are estimated to teach eight courses per year, which is far more than most full-time faculty teach.[29] Most adjuncts are stuck in an endless cycle of short-term work: “over 80% of respondents reported teaching part-time for more than three years, and over half for more than six years.”[30]
In response to low wages, lack of benefits, and absence of institutional support, many adjuncts are turning to the collective power of unions.[31] Among the surveyed part-time faculty, unions have made a difference. Adjuncts who are represented by unions earn a median pay per course of $3,100 compared to $2,475 for non-union.[32] Among part-time adjuncts at institutions where a union is present, 30 percent have health benefits that are either entirely paid by the employer or the cost is shared by the employer and employee. Where there is no union present, just 11 percent had access to health benefits through their employer. In the case of retirement benefits, 49 percent of part-time adjuncts who taught where a union was present had retirement benefits that were fully or partially paid by the employer, compared to 20 percent of adjuncts at institutions where no union was present.[33]
Contingent Workforce Size Estimates
Numerous studies have released estimates in an attempt to quantify the contingent workforce. Independent surveys define the contingent workforce differently with some surveys including standard part-time workers who are employees and not independent contractors or self-employed.
In 2005, the CPS contingent worker supplement estimated the contingent workforce to be 14.8 million.[34] The CPS estimate includes independent contractors, on-call workers, temporary help agency workers, and workers provided by contract firms. The research for this fact sheet found that in 2015, there were nearly 21.6 million self-employed and temporary workers in the U.S. Among those, 9.2 million worked in management, professional, and related occupations.
In November 2015, economists Lawrence Katz and Alan Krueger conducted a version of the CPS contingent worker supplement as part of the RAND Corporation American Life Panel. Their findings showed that the percentage of workers engaged in alternative work arrangements (defined as temporary help agency workers, on-call workers, contract workers, and independent contractors – the same definitions used by the CPS supplement) rose from 10.1 percent in 2005 to 15.8 percent in 2015. This represents an addition of 9.4 million workers engaged in alternative work arrangements over a ten year period.[35]
The Freelancers Union, an organization that “promotes the interests of independent workers through advocacy, education, and services,” estimates that there are 54 million contingent workers in the U.S. (or about a third of the workforce). The Freelancers Union defines the contingent workforce to include contract company workers, agency temps, on-call workers/day laborers, direct-hire temps, self-employed workers, independent contractors, and standard part-time workers.[36]
A survey by MBO Partners, estimated that there were 16.9 million full-time contingent workers in the U.S. in 2015, 900,000 fewer than there were in 2013.[37] The survey also estimated that there were an additional 12.4 million part-time independent workers. MBO Partners defined contingent workers “as people who work at least 15+ hours per week in non-traditional, non-permanent full or part-time employment and includes workers who identify themselves as consultants, freelancers, contractors, self-employed, and on-call workers, among others.”[38] Survey responses were gathered from online survey, which may affect reliability since the respondents appear to be self-selected and require internet access or an email address.
The Online “Gig Economy”
In recent years, the number of contingent workers who are part of the “online gig economy” – where online technology is used to contract workers for specific, on-demand services – has increased. Estimates for how many workers are involved in this segment of the economy vary widely depending on the method used for measuring this rapidly changing workforce. A 2015 discussion paper by the Hamilton Project estimated 0.4 percent of total U.S. employment was earning money in the “gig economy” based on an analysis of Google search terms related to online intermediaries.[39] The modified contingent worker supplement survey conducted by Katz and Krueger found 0.5 percent of the U.S. workforce to be part of the “gig economy.”[40] Other estimates put the figure much higher. The McKinsey Global Institute estimated as much as one percent of the U.S. workforce is part of the online “gig economy” in 2015.[41]
Long-Term Challenges Facing the Contingent Workforce
One of the advantages often cited by employers as a reason to hire independent workers is the cost savings. Cost savings for employers include not having to contribute to Social Security, unemployment insurance, or Medicare; provide health insurance; or pay toward a retirement benefit. The savings to employers for hiring independent workers can be as much as 20 to 40 percent according to one estimate.[42] However, this is a cost that must be borne by the worker and many choose to forgo retirement and health insurance.
Retirement and Pension Plan Coverage
Self-employed workers are responsible for funding their own retirement plan. Since self-employed and independent contractors do not have a traditional employer/employee work arrangement, they do not receive contribution toward a pension. Self-employed workers are more likely than traditional full-time workers to have an individual retirement account or Keogh plan.
The 2005 contingent worker supplement showed that 51 percent of contingent workers in management, professional, and related occupations had a pension plan or individual retirement plan/Keogh plan.[43] In 2014, among all management, professional, and related workers, 83 percent had access to a retirement plan (71 percent actually participated).[44]
Health Insurance
Access to affordable health insurance is a persistent problem for contingent workers. The passage of the Affordable Care Act removes the access barrier, but for a workforce that can face inconsistent employment, the affordability of health insurance remains a concern.
Among self-employed workers in management, professional, and related occupations in 2014, 12 percent did not have health insurance coverage. Just six percent of traditionally employed workers in management, professional, and related occupations were without health insurance coverage in 2014.[45] Among self-employed non-professional workers, 26 percent lacked health insurance while 19 percent of non-professional workers lacked insurance overall. [46]
Worker Protections
Many workplace laws designed to protect employees, are not applicable to the self-employed or independent contractors. Important protections that may not be applicable, even though a contingent worker is located at an employer’s worksite include: the Family and Medical Leave Act; the Employee Retirement Income Security Act; the Fair Labor Standards Act, which established minimum wage, overtime, and child labor laws; and the National Labor Relations Act, which established the right to organize a union and bargain collectively. Self-employed workers and independent contractors who are properly classified as such are not eligible for workers’ compensation or unemployment insurance.[47]
Conclusion
Growth in the professional contingent workforce is largely driven by temporary workers, workers on short-term contracts, like adjuncts, and self-employed workers in some arts and media occupations. For some of these workers, contingent employment means creative freedom and control over their schedule. For others, contingent employment has meant limited access to health and retirement benefits and inconsistent employment. Many adjuncts have fought the workplace imbalance through the collective power of unions and have achieved gains.
Related reading:
The Union Difference for Working Professionals
I'm a Professional. What can a union do for me?
August 2016
[a] Defined by the U.S. Bureau and Labor Statistics to include management; business and financial operations; computer and mathematical; architecture and engineering; life, physical, and social science; community and social service; legal; education, training, and library; arts, design, entertainment, sports and media; and healthcare practitioners and technical. This author also uses “professional and technical occupations” to refer to the same occupational grouping.
[b] Management occupations include: chief executives; general and operations managers; public relations and fundraising managers; lodging managers; purchasing managers; farmers, ranchers, and other agricultural managers; and construction managers.
[c] Self-employment is high in legal occupations, because many lawyers start their own law firms.
[1] Internal Revenue Service, Independent Contractor Defined. http://www.irs.gov/Businesses/Small-Businesses-%26-Self-Employed/Independent-Contractor-Defined
[2] U.S. Census Bureau, DataFerrett, Current Population Survey, Basic Monthly Microdata, Annual Averages 2005 and 2015
[3]Ibid.
[4] Ibid.
[5] U.S. Census Bureau, DataFerrett, Current Population Survey, Basic Monthly Microdata, July 2016.
[6] Ibid.
[7] Ibid.
[8] U.S. Census Bureau, DataFerrett, Current Population Survey, Basic Monthly Microdata, 2015 Annual Average.
[9] U.S. Census Bureau, DataFerrett, American Community Survey, Public Use Microdata Sample, 2014.
[10] U.S. Bureau of Labor Statistics, Databases, Tables & Calculators by Subject, Employment, Hours and Earnings from the Current Employment Statistics survey, Temporary help services industry. http://data.bls.gov/timeseries/CES6056132001
[11] U.S. Bureau of Labor Statistics, Current Employment Statistics, CES Databases, All employees, not seasonally adjusted, 2006 - 2016.
[12] Tian Luo, Amar Mann, and Richard Holden, “The expanding role of temporary help services from 1990 to 2008.” Monthly Labor Review, August 2010.
[13] U.S. Bureau of Labor Statistics, Current Employment Statistics, CES Databases, All employees, not seasonally adjusted, Temporary Help Services, December 2015.
[14] Ibid.
[15] U.S. Bureau of Labor Statistics, Occupational Employment Statistics, National Industry-Specific Occupation Employment and Wage Estimates, May 2005 and 2015
[16] Johns Hopkins Medicine. “Temporary ER Staff Poses Increased Safety Risk to Patients.” News Release. August 25, 2011. Available at: http://www.hopkinsmedicine.org/news/media/releases/temporary_er_staff_poses_increased_safety_risk_to_patients
[17] Weber, Tracy and Charles Ornstein, “Temp Firms a Magnet for Unfit Nurses.” ProPublica. December 5, 2009. Available at: http://www.propublica.org/article/temporary-nurses-danger-inadequate-oversight-1206
[18] U.S. Census Bureau, DataFerrett, Current Population Survey, Contingent Worker Supplement, February 2005.
[19] Katz, Lawrence and Alan Krueger. “The Rise of Alternative Work Arrangements in the United States, 1995-2015”. National Bureau of Economic Research. March 29, 2016.
[20] U.S. Bureau of Labor Statistics, News, Contingent and Alternative Employment Arrangements, February 2005.
[21] Katz, Lawrence and Alan Krueger. “The Rise of Alternative Work Arrangements in the United States, 1995-2015”. National Bureau of Economic Research. March 29, 2016.
[22] Curtis, John W, “The Employment Status of Instructional Staff Members in Higher Education, Fall 2011,” American Association of University Professors, April 2014.
[23] Flaherty, Colleen, “Making the Case for Adjuncts.” Inside Higher Ed. January 9, 2013. Available at: http://www.insidehighered.com/news/2013/01/09/adjunct-leaders-consider-strategies-force-change
[24] The Coalition on the Academic Workforce, “A Portrait of Part-Time Faculty Members.” June 2012.
[25] “The Employment Status of Instructional Staff Members in Higher Education, Fall 2011”
[26] American Association of University Professors, Instructional Faculty by Rank and Reporting Category, 2013 (pdf). A figure from the 2014-15 Annual Report on the Economic Status of the Profession. Available at: https://www.aaup.org/sites/default/files/files/2015salarysurvey/Fig4.pdf
[27] The Coalition on the Academic Workforce. June 2012.
[28] Ibid.
[29] Ibid.
[30] Ibid.
[31] See Snyder, Susan, “A union push to organize Philly-area college adjuncts.” Philly.com. December 16, 2013.
[32] The Coalition on the Academic Workforce, Table 25.
[33] Ibid. Table 36 and 37.
[34] U.S. Department of Labor, Bureau of Labor Statistics, “Contingent and Alternative Employment Arrangements,” News Release, July 27, 2005.
[35] Katz, Lawrence and Alan Krueger. “The Rise of Alternative Work Arrangements in the United States, 1995-2015”. National Bureau of Economic Research. March 29, 2016.
[36] Horowitz, Sara, and Fabio Rosati. 2015. “Freelancing in America: A National Survey of the New Workforce.” Freelancers Union & Upwork.
[37] MBO Partners, “The State of Independence in America: Sixth Annual Independent Workforce Report,” September 2016.
[38] Ibid.
[39] Harris, Seth D. and Alan B. Krueger. “A Proposal for Modernizing Labor Laws for Twenty-First-Century Work: The ‘Independent Worker’”. The Hamilton Project. December 2015.
[40] Katz, Lawrence and Alan Krueger. “The Rise of Alternative Work Arrangements in the United States, 1995-2015”. National Bureau of Economic Research. March 29, 2016.
[41] McKinsey Global Institute. 2015, June. “Connecting Talent with Opportunity in the Digital Age.” Retrieved from: http://www.mckinsey.com/global-themes/employment-and-growth/connecting-talent-with-opportunity-in-the-digital-age
[42] Steven Cohen and William B. Eimicke, “Independent Contracting, Policy Management Analysis.” New York City, August 2013.
[43] U.S. Census Bureau, DataFerrett, Current Population Survey, Contingent Worker Supplement, February 2005.
[44] U.S. Bureau of Labor Statistics, “Employee Benefits in the United States,” BLS News Release, July 24, 2015. Available at: http://www.bls.gov/news.release/pdf/ebs2.pdf
[45] U.S. Census Bureau, DataFerrett, American Community Survey, Public Use Microdata, 2014.
[46] Ibid.
[47] United States Government Accountability Office, “Employment Arrangements: Improved Outreach Could Help Ensure Proper Worker Classification.” GAO-06-656. July 2006.