Fact Sheets
For questions about our fact sheets, contact DPE Research and Outreach Manager Alana Staiti at astaiti@dpeaflcio.org.
Safe Staffing: Critical for Patients and Nurses
Fact Sheet 2024
Highlights
Research has shown that reducing patient-to-nurse ratios in hospitals improves patient care outcomes, helps prevent burnout among nurses, and contributes to less turnover.
The combination of chronic understaffing, heavy workloads, and stressful work environments in hospitals and long-term care facilities contributes to greater risk of occupational hazards, nurse burnout, and attrition.
Aside from advocating for legislation to establish safe staffing ratios, nurses and other healthcare professionals can achieve staffing protections and have a greater say in their workplaces through collective bargaining.
Introduction
Nurses play an integral role in the health care system. They provide acute care for patients and administer medicine and other daily essentials in our country’s hospitals, ambulatory healthcare facilities, long-term care facilities, and in many other places. But far too often, nurses are overworked and under-supported, while healthcare administrators seek to lower costs and boost profits.
In the face of aggressive cost-cutting, minimum staffing levels are necessary to ensure the safety of patients and nurses. Adequate nurse staffing is key to improving patient care and nurse retention, while inadequate staffing endangers patients and drives nurses from the profession. Unfortunately, staffing problems are only expected to get worse as baby boomers age and the demand for health care services grows, making staffing a growing concern for nurses and patients alike.
Safe staffing measures improve patient care outcomes
Ample research has shown that the implementation of safe staffing measures, like reducing patient-to-nurse ratios, improves patient care outcomes. In 1999, California became the first state to pass a law setting a legal maximum patient-to-nurse staffing ratio in order to improve patient care. Since it was fully implemented in 2004, there have been measurably improved patient outcomes in California. This is in line with the broader academic consensus about the positive impact of lowering nurse workloads.
A comprehensive study published in 2010 about the impact of the 1999 law compared hospitals in California to hospitals in New Jersey and Pennsylvania. Researchers found significantly better health outcomes in California, including lower surgical mortality rates, reduced inpatient deaths within 30 days of admission, and a lower likelihood of death from failing to properly respond to symptoms.[1]
These conclusions are backed up by a 2018 meta-analysis of other research, which found that for every increase of one nurse, patients had a 14 percent decrease in risk for in-hospital mortality.[2] An earlier analysis produced similar results, showing in 2007 that an increase of one full-time registered nurse (RN) in a unit per day would result in nine percent fewer hospital-related deaths in the ICU, 16 percent fewer deaths for surgical patients and six percent fewer deaths for medical patients.[3]
In long-term care facilities, patients with more direct time with RNs (30 to 40 minutes daily per patient) reported fewer pressure ulcers, acute care hospitalizations, urinary tract infections, urinary catheters, and less deterioration in their ability to perform daily living activities.[4]
While increased nurse staffing greatly improves patient outcomes in hospitals with positive nurse working conditions, studies have shown that it has little to no effect in hospitals that otherwise have poor nurse working conditions. Good nursing work environments are characterized by positive working relationships between doctors and nurses, active nurse involvement in hospital decision making, management responding to nurses’ concerns about patient care, continuing education programs for nurses, and constant quality improvement for patient care programs.[5]
Inadequate staffing endangers patients and nurses alike
Inadequate nurse staffing and poor nurse working conditions are closely associated with poor patient outcomes. High patient-to-nurse ratios are correlated with an increase in medical errors, as well as cases of patient infections, bedsores, pneumonia, cardiac arrest, and accidental death.[6]
A 2021 study found that in hospital medical surgical units in Illinois, for each patient added to a nurse’s average workload, the likelihood of the patient dying within 30 days of admission increased by 16 percent, and the likelihood that the patient stayed in the hospital for a day longer increased by five percent.[7] The same study estimated that if the hospitals were staffed at four patients to one nurse during the study period, “more than 1595 deaths would have been avoided.”[8]
Both nurse work environments and patient-to-nurse ratios may be associated with survival rates. A 2016 study found that the likelihood of survival of patients recovering from an in-hospital cardiac arrest was 16 percent lower in hospitals with poor nursing work environments and five percent lower for each additional patient per nurse on medical-surgical units.[9]
Even temporary exposure to high nursing workloads and limited staffing can have a negative impact on patients. In 2017, researchers found that “exposure to as little as one day of high workload/staffing ratios is associated with a substantially increased risk of death in critically ill patients.”[10]
Heavy nurse workloads, evidenced by shift length, is significantly related to decreases in patient satisfaction. In hospitals with large proportions of nurses working shifts of 13 hours or longer, more patients reported that they were not likely to recommend the hospital to family and friends compared to patients in hospitals with shift lengths of 11 hours or less.[11]
Nurse understaffing contributes to greater risk of workplace injuries and illnesses
Understaffing and heavy workloads contribute to greater risk of occupational hazards and burnout among nurses and other healthcare staff.
According to the U.S. Bureau of Labor Statistics (BLS), in 2022, skilled nursing facilities and residential facilities were the workplaces with the highest rates of reported incidents of illness or injury resulting in either one or more days away from work, restricted job activity or job transfer. Hospitals had among the highest rates of these reported incidents as well that year.[12]
According to the BLS, during the two-year period spanning 2021 and 2022, registered nurses experienced 221,600 reported incidents of illness or injury resulting in either one or more days away from work, restricted job activity, or job transfer. Nursing assistants experienced 302,770 incidents during that period.[13] These alarming figures represent reported incidents in the private sector only.
But safe staffing policies can help reduce the risks faced by nurses and other healthcare professionals. A 2015 study of hospitals in California found 31.6% fewer RN injuries and 38.2% fewer licensed practical nurse (LPN) injuries than what would have been expected based on data from the other 49 states and the District of Columbia.[14]
Understaffing contributes to nurse fatigue, health issues, and job dissatisfaction
High patient-to-nurse ratios are strongly associated with emotional exhaustion, job dissatisfaction and fatigue. Nurse fatigue (sometimes called burnout) can be described by a number of symptoms, including irritability, insomnia, headaches, back pain, weight gain, and high blood pressure. Working long hours with inadequate staffing also increases nurses’ risk of developing conditions such as musculoskeletal disorders, hypertension, cardiovascular issues, type 2 diabetes, and depression, among other conditions.[15]
Nurses’ cardiovascular health often suffers as a result of working long shifts and overtime. In a 2010 study, researchers showed a clear trend between frequent overtime work and incidents of heart disease, with workers who reported three to four hours of overtime per day being 60 percent more likely to have cardiovascular health disorders.[16]
Nurse fatigue itself can hurt patient care outcomes. A 2012 study found that reducing the number of nurses with high levels of fatigue from the average of 30 percent to 10 percent could prevent 4,160 infections in Pennsylvania hospitals alone, saving approximately $41 million.[17]
A 2002 study found that the addition of each patient over four patients per nurse carried a 23 percent risk of increased nurse burnout and a 15 percent decrease in job satisfaction. The same study found that each additional patient per nurse was associated with a seven percent increase in the likelihood of the patient dying within 30 days of admission.[18]
A 2023 study involving both nurses and physicians at 60 Magnet hospitals across the U.S. found that nurse staffing was the primary issue that subjects identified as wanting management to improve. Additionally, the study revealed that “hospitals characterized as having too few nurses and unfavorable work environments had higher rates of clinician burnout, turnover, and unfavorable patient safety ratings.”[19]
“When they’re understaffed, nurses are required to cut corners to get the work done the best they can. Then when there’s a bad outcome, hospitals fire the nurse for cutting corners.”
Chronic understaffing is exacerbating the nursing shortage
Before the COVID-19 pandemic (hereafter, the pandemic), the nurse staffing crisis had already been plaguing U.S. hospitals and other healthcare facilities for several years. The pandemic further contributed to burnout among nurses[21] and raised in relief the multi-pronged crises facing healthcare professionals, due in large part to understaffing issues, not only in hospitals across the country but around the world.[22] Without widespread safe staffing measures in place to reduce nurse burnout and turnover, the staffing crisis is likely to be compounded in the future.
The BLS estimates that between 2023 and 2033, the employment of registered nurses will increase six percent – two percentage points greater than the average projected growth rate of all occupations. An average of 194,500 new nursing jobs each year are projected over this ten-year period.[23]
According to the BLS, the number of advanced practice registered nurses (including nurse anesthetists, nurse practitioners, and nurse midwives) in the U.S. is projected to grow 40 percent between 2023 and 2033, which is significantly faster than average.[24]
A 2023 survey of over 18,000 nurses revealed that subjects expressed grave concern about the nurse staffing shortage, and career satisfaction declined significantly since the survey was conducted two years prior. Additionally, the percentage of nurses who agreed with the statement that the current staffing shortage was worse than five years ago rose staggeringly, “from 37% in 2015 to 89% in 2023.”[25]
The costs of nurse turnover and temporary labor
Chronic understaffing is among the reasons why many in the nursing profession seek part-time nursing jobs or travel nursing jobs. This phenomenon has especially been the case since the start of the pandemic, when many nurses chose to leave the profession altogether or retire earlier than originally planned.
The 2023 survey of over 18,000 nurses found that 30 percent of respondents said they would likely leave their career due to the pandemic. This figure rose seven percentage points since the last survey completed two years prior.[26]
Nurse turnover is costly for hospitals. According to a 2022 report by the Society for Human Resource Management, the average cost-per-hire of an employee is $4,683.[27]
A 2013 study found that nurse turnover was a significant factor in patient outcomes in nursing homes, linking nursing homes with high turnover of certified nursing assistants (CNAs) to “significantly higher” chances of patient conditions including pressure ulcers and urinary tract infections.[28]
In addition to enforcing mandatory overtime, employers often use supplemental nurses to temporarily fill gaps in nurse staffing. These temporary nurses are more likely to be concentrated in hospitals with poor staffing ratios and inadequate resources.
The pandemic caused a sharp rise in the number of supplemental or travel nurses in hospitals across the country; from 2019 to 2020, the number of travel nurses grew 35 percent.[29] In general, the number of these types of nurses employed in hospitals varies depending on the hospital size and geographic location. A 2024 study by the U.S. Government Accountability Office found that among the hospitals studied, the increase in the number of supplemental nurses from 2019 to 2022 ranged from two to 28 percent.[30]
Temporary nurses are often compensated triple or even quadruple the rate of a regular full-time RN, further adding to cost and contributing to resentment among permanent nurses.[31]
As the percentage of temporary nurses employed goes up, the quality of patient care tends to go down. A 2005 study found that hospitals with temporary nurse staffing under five percent reported fewer hospital-acquired infections and fewer patient falls than hospitals with temporary nurse staffing at five to 15 percent. The percentage of nurse work-related injuries was also significantly higher in hospitals where temporary nurses made up more than 15 percent of the total nursing staff.[32]
Safe staffing may be an effective way to retain experienced nurses and lure back those who left the field
Soon after patient-to-nurse ratio regulations went into effect in January 2004, the California Board of Nursing reported being inundated with RN applicants from other states. That year, applications for nursing licenses increased by more than 60 percent. By 2008, vacancies for registered nurses at California hospitals plummeted by 69 percent.[33]
Many researchers have found that factors such as mandatory overtime are inversely associated with nurses’ intention to stay in their jobs.[34] Almost 18 percent of new registered nurses leave their first nursing job within the first year, and one in three nurses leave their first job within two years.[35]
While wage levels are an important part of determining how satisfied a nurse is with their job, it takes more than good pay to keep nurses in their jobs in the long-run. In fact, researchers have found that the most impactful way to decrease nurse fatigue and increase retention is to improve the work environment and maintain reasonable patient-to-nurse staffing ratios.[36]
In the 2010 study of California’s staffing law, both nurses and nurse managers agreed that the ratio legislation achieved its goals of improving recruitment and retention of nurses, reducing nurse workloads, and improving the quality of care.[37]
Safe staffing measures do not burden hospitals
The majority of available research shows that safe staffing practices are cost-effective for hospitals. High turnover rates and the overreliance on temporary nurse staffing increase the average cost per discharge (cost of inpatient care, including administration) and overall operating costs. Safe staffing policies improve nurse performance and patient-mortality rates and reduce turnover rates, staffing costs, and liability.
“It is costing hospitals more money not to spend money on nursing.”
The 2021 study of hospital medical surgical units in Illinois found that a staffing ratio of four patients to one nurse would have saved a total of $117 million per year across the hospitals in the study due to reduced lengths of stay.[39]
Though nursing is often the largest line-item cost for hospitals, a 2013 study found that higher levels of nurse staffing contributed towards positive financial performance for hospitals in competitive markets as improved productivity, reductions in secondary infections and a reduction in the average length of patient stays lead to cost savings and productivity in the long-term.[40]
A 2009 study found that adding an additional 133,000 RNs to the hospital workforce across the U.S. would produce medical savings estimated at $6.1 billion in reduced patient care costs. This does not include the additional value of increased productivity when nurses help patients recover more quickly, an estimated $231 million savings per year.[41]
Safe staffing ratios also reduce the additional costs of supplemental nurses and staffing agencies, as nurse retention tends to go up with safe staffing.[42] Temporary nurses are more expensive for hospitals to hire and, as previously stated, do not provide the same quality of care when compared to staff nurses.
The role of other healthcare professionals
While much of the debate and research surrounding the issue of hospital staffing focuses on RNs, many other types of professionals and support staff work in important and understaffed patient care roles as well.
Social workers can play a critical role in ensuring patients have the resources they need to continue receiving healthcare in a timely, cost-effective manner after they are discharged from the hospital. Studies have shown that increased support services from social workers in hospitals can lead to lower total hospital costs and increased physician follow up after discharge.[43]
Physical and occupational therapists play a similar role in ensuring patient care transitions are as smooth and successful as possible. Especially in the treatment of older adults, research shows that physical therapists should be relied on more in order to “assess and address post hospitalization physical and functional deficits.”[44] Such changes can again play a role in reducing readmissions, improving patient care outcomes and reducing overall medical costs.
It is estimated that at least one third of patients are malnourished when they arrive at American hospitals. While hospitals place responsibility for patient nutrition on dieticians, many institutions lack an adequate number of staff dieticians to adequately address all patient needs and existing dieticians’ recommendations are often not implemented properly. To boost the quality of care and improve the chances for patient recovery, investments need to be made into professional dietician services.[45]
All of these professionals are supported every day by LPNs, CNAs, and other staff without whom hospitals would not function. The term “skill mix” in clinical settings is used to characterize the number and educational experience of nurses. While scientific studies have not come to a consensus about whether there is a significant relationship between the number of LPNs or CNAs and patient outcomes, studies have confirmed that a “richer” skill mix of RNs, or a skill mix consisting of a higher proportion of RNs, leads to better patient outcomes and fewer hospital costs.[46]
Solutions to improve nurse working conditions
While nurse fatigue and the nursing shortage is lamented across the country, the push to boost hospital profit margins and reduce costs has left some nurses feeling left out of the conversation. For more than three decades, registered nurses and other healthcare professionals have been joining together through their unions and professional associations to advocate for safe staffing standards and mechanisms. These mechanisms can take various forms, including negotiating staffing ratios or nurse staffing committees in collective bargaining agreements, and enacting safe staffing legislation at the state and federal level.
““We’re lauded for our work, but when we present our recommendations — what we need in order to provide quality care — we’re brushed off and ignored.””
Union success stories where safe staffing was a central issue
Nurses who are union members use their power at the bargaining table to push for improved staffing standards. The following cases are examples of union success stories just within the past year in which safe staffing was a central issue.
2024
Nurses at the Kapi’olani Medical Center for Women and Children, members of the Hawai’i Nurses’ Association, an affiliate of the Office and Professional Employees International Union (OPEIU), voted overwhelmingly to ratify their collective bargaining agreement that includes a major win for both the nurses and their patients – “the state’s first contractually enforceable staffing ratios.”[48]
RNs and other healthcare professionals who are members of the United Health Professionals of New Mexico, an affiliate of the American Federation of Teachers (AFT), successfully negotiated for the creation of a labor-management committee that, among other things, will address safe staffing ratios and job protections.[49]
Nurses who are members of Health Professionals and Allied Employees (HPAE), an affiliate of AFT, at the Palisades Medical Center in New Jersey ratified a contract that establishes patient-to-nurse ratios for the first time at this hospital.[50] HPAE nurses at Englewood Hospital and Medical Center and Cooper University Health Care ratified new contracts that include enforceable staffing ratios.[51]
Increased staffing levels were a central organizing issue of the Patient Care Associates (PCAs) and Psychiatric Care Technicians (PCTs) at the Ohio State University’s Wexner Medical Center, who voted to join the International Association of Machinists and Aerospace Workers (IAMAW). The organizing efforts of these healthcare workers were supported by the 4,000 RNs at Wexner who are already represented by the Ohio Nurses Association, an affiliate of AFT.[52]
2023
Nurses at Robert Wood Johnson University Hospital in New Brunswick, New Jersey who are members of the United Steelworkers (USW) secured guidelines and enforcement mechanisms for safe staffing levels.[53]
Nurses at Oregon Health and Science University who are members of the Oregon Nurses Association, an AFT affiliate, ratified their contract that stipulates minimum staffing standards in accordance with a 2023 Oregon state law for hospital staffing (see next section), as well as a strengthened nurse staffing committee.[54]
Legislation for safe staffing at the state level
California is still the only state with a law mandating maximum patient-to-nurse ratios in all hospital units at all times.
In 2023, the state of Oregon enacted minimum nurse staffing ratios for several hospital units, including “emergency departments, intensive care units, labor and delivery units, operating rooms, and others.”[55] The law also established two new staffing committees – one for service staff and another for professional and technical hospital workers, as well as complaint-driven enforcement mechanisms and legitimate rest and meal breaks. Lastly, the law also established staffing ratios for CNAs.[56]
In 2021, New York passed a law establishing patient-to-nurse ratios in acute care facilities and residential health care facilities. Ratios were also established for unlicensed direct care staff.[57]
Massachusetts passed a law in 2014 requiring a maximum of two patients for every nurse in intensive care units.[58]
Seven states (CT, IL, NV, OH, OR, TX, WA) require hospitals to have committees responsible for developing staffing policies unique to their hospitals, one state (MN) requires hospitals’ chief nursing officers or their designee design a staffing plan in consultation with other hospital staff, and five states (IL, NJ, NY, RI, VT) require public disclosure and/or reporting of hospital staffing policies.[59]
Additionally, 18 states (AK, CA, CT, IL, ME, MD, MA, MN, MO, NH, NJ, NY, OR, PA, RI, TX, WA, WV) have laws that prohibit or severely restrict hospitals from assigning mandatory overtime to nurses.[60]
While nurses, patient advocates, and other organizations have organized in other states to pass safe staffing legislation similar to California’s, they have encountered well-funded opposition campaigns, anchored by state hospital associations. Most recently, the Massachusetts Health and Hospital Association spent $25.18 million to defeat the high profile 2018 ballot initiative campaign.[61]
Legislation for safe staffing at the federal level
Multiple attempts have been made to pass legislation to ensure safe staffing levels in every hospital in the U.S., though none have been successful so far. However, in 2024, the first federally-imposed rules for minimum nurse staffing requirements in long-term care facilities were put into effect.
In 2024, the Centers for Medicare & Medicaid Services established minimum nurse staffing requirements for long-term care facilities, including 24/7 RN on-site requirements and the input of RNs and unlicensed direct care staff in facility assessments.[62]
In 2023, Senator Sherrod Brown (D-OH) and Rep. Jan Schakowsky (D-IL) reintroduced the Nurse Staffing Standards for Hospital Patient Safety and Quality Care Act. This legislation and previous iterations have been endorsed by the AFL-CIO, American Federation of Government Employees (AFGE), AFT, and USW, among other labor unions and nurses’ organizations.
————
[1] Aiken, L. H., Sloane, D. M., Cimiotti, J. P., Clarke, S. P., Flynn, L., Seago, J. A., Spetz, J., Smith, H. L. (2010). Implications of the California nurse staffing mandate for other states. Health services research 45(4), 904–21. doi: 10.1111/j.1475-6773.2010.01114.x
[2] Driscoll, A., Grant, M. J., Carroll, D., Dalton, S., Deaton, C., Jones, I., Astin, F. (2018). The effect of nurse-to-patient ratios on nurse-sensitive patient outcomes in acute specialist units: a systematic review and meta-analysis. European Journal of Cardiovascular Nursing, 17(1), 6–22. https://doi.org/10.1177/1474515117721561.
[3] Kane, R. L., Shamliyan, T. A., Mueller, C., Duval, S., & Wilt, T. J. (2007). The association of registered nurse staffing levels and patient outcomes: systematic review and meta-analysis. Medical care, 45(12), 1195–1204. https://doi.org/10.1097/MLR.0b013e3181468ca3.
[4] Hughes, Rhonda G. (Ed.). (2008) Patient Safety and Quality: An Evidence-Based Handbook for Nurses. Agency for Healthcare Research and Quality. Retrieved from https://pubmed.ncbi.nlm.nih.gov/21328752/.
[5] See, for example, Rosenbaum, K.; Lasater, K.; McHugh, M.; Lake, E. (2024). Hospital Performance on Hospital Consumer Assessment of Healthcare Providers and System Ratings: Associations With Nursing Factors. Medical Care 62(5): 288-295. doi:10.1097/MLR.0000000000001966; and Aiken, L. H., Cimiotti, J. P., Sloane, D. M., Smith, H. L., Flynn, L., & Neff, D. F. (2011). Effects of nurse staffing and nurse education on patient deaths in hospitals with different nurse work environments. Medical care, 49(12), 1047–1053. doi:10.1097/MLR.0b013e3182330b6e
[6] See, for example: Spence Laschinger, H. K., & Leiter, M. P. (2006). The impact of nursing work environments on patient safety outcomes: the mediating role of burnout/engagement. The Journal of Nursing Administration, 36(5), 259–267. https://doi.org/10.1097/00005110-200605000-00019; Cimiotti, J.P., Haas, J., Saiman, L. and Larson, E.L. (2006) Impact of Staffing on Bloodstream Infections in the Neonatal Intensive Care Unit. Archives of Pediatrics and Adolescent Medicine, 160, 832-836. https://doi.org/10.1001/archpedi.160.8.832; “MRSA ‘linked to nurse shortages’.” (May 6, 2005). BBC News. Retrieved from http://news.bbc.co.uk/1/hi/health/4522141.stm; Page, A. (Ed.). (2004). Keeping Patients Safe: Transforming the Work Environment of Nurses. Institute of Medicine, National Academy of Sciences. Retrieved from https://pubmed.ncbi.nlm.nih.gov/25009849/; “Strategies for Addressing the Evolving Nursing Crisis.” The Joint Commission Journal on Quality and Safety, 29(1), 41-50; and Needleman, J., Buerhaus, P., Mattke, S., Stewart, M., & Zelevinsky, K. (2002). Nurse-staffing levels and the quality of care in hospitals. The New England journal of medicine, 346(22), 1715–1722. https://doi.org/10.1056/NEJMsa012247.
[7] Lasater K.B., Aiken, L.H., Sloane, D., et al. Patient outcomes and cost savings associated with hospital safe
nurse staffing legislation: an observational study. BMJ Open (2021), 11. doi:10.1136/bmjopen-2021-052899.
[8] Ibid.
[9] McHugh, M. D., Rochman, M. F., Sloane, D. M., Berg, R. A., Mancini, M. E., Nadkarni, V. M., Merchant, R. M., Aiken, L. H., & American Heart Association’s Get With The Guidelines-Resuscitation Investigators (2016). Better Nurse Staffing and Nurse Work Environments Associated With Increased Survival of In-Hospital Cardiac Arrest Patients. Medical care, 54(1), 74–80. https://doi.org/10.1097/MLR.0000000000000456.
[10] Lee, A., Cheung, Y., Joynt, G. M., Leung, C., Wong, W. T., & Gomersall, C. D. (2017). Are high nurse workload/staffing ratios associated with decreased survival in critically ill patients? A cohort study. Annals of intensive care, 7(1), 46. https://doi.org/10.1186/s13613-017-0269-2.
[11] Stimpfel AW, Sloane DM, Aiken LH. The longer the shifts for hospital nurses, the higher the levels of burnout and patient dissatisfaction. Health Aff (Millwood). (2012 Nov) 31(11), 2501-9. doi: 10.1377/hlthaff.2011.1377.
[12] Table SNR02. Highest incidence rates of nonfatal occupational injury and illness cases with days away from work, restricted work activity, or job transfer, 2022. U.S. Bureau of Labor Statistics, Injuries, Illnesses, and Fatalities. Retrieved from https://www.bls.gov/iif/nonfatal-injuries-and-illnesses-tables.htm.
[13] Table R9. Number of nonfatal occupational injuries and illnesses involving days away from work, restricted activity, or job transfer (DART), days away from work (DAFW), and days of restricted work activity, or job transfer (DJTR) by occupation and selected natures of injury or illness, private industry, 2021-2022. U.S. Bureau of Labor Statistics, Injuries, Illnesses, and Fatalities.
[14] Leigh, J. P., Markis, C. A., Iosif, A. M., & Romano, P. S. (2015). California's nurse-to-patient ratio law and occupational injury. International archives of occupational and environmental health, 88(4), 477–484. https://doi.org/10.1007/s00420-014-0977-y.
[15] Salvagioni, D.A.J., Melanda, F.N., Mesas, A.E., González, A.D., Gabani, F.L., et al. (2017) Physical, psychological and occupational consequences of job burnout: A systematic review of prospective studies. PLOS ONE 12(10). https://doi.org/10.1371/journal.pone.0185781.
[16] Virtanen, M., Ferrie, J. E., Singh-Manoux, A., Shipley, M. J., Vahtera, J., Marmot, M. G., & Kivimäki, M. (2010). Overtime work and incident coronary heart disease: the Whitehall II prospective cohort study. European heart journal, 31(14), 1737–1744. https://doi.org/10.1093/eurheartj/ehq124.
[17] Cimiotti, J. P., Aiken, L. H., Sloane, D. M., & Wu, E. S. (2012). Nurse staffing, burnout, and health care-associated infection. American journal of infection control, 40(6), 486–490. doi:10.1016/j.ajic.2012.02.029
[18] Aiken, L.H., Clarke, S.P., Sloane, D.M., Sochalski, J., Silber, J.H. (2002). Hospital nurse staffing and patient mortality, nurse burnout, and job dissatisfaction. Journal of the American Medical Association. 288(16), 1987–1993. https://doi.org/10.1001/jama.288.16.1987.
[19] Aiken, L. H., Lasater, K. B., Sloane, D. M., Pogue, C. A., Fitzpatrick Rosenbaum, K. E., Muir, K. J., McHugh, M. D., & US Clinician Wellbeing Study Consortium (2023). Physician and Nurse Well-Being and Preferred Interventions to Address Burnout in Hospital Practice: Factors Associated With Turnover, Outcomes, and Patient Safety. JAMA health forum, 4(7). https://doi.org/10.1001/jamahealthforum.2023.1809.
[20] Robbins, A. (May 28, 2015). We need more nurses. The New York Times. Retrieved from https://www.nytimes.com/2015/05/28/opinion/we-need-more-nurses.html.
[21] See, for example, Martin B., Kaminski-Ozturk N., O'Hara C., Smiley R. (2023). Examining the Impact of the COVID-19 Pandemic on Burnout and Stress Among U.S. Nurses. Journal of Nursing Regulation 14(1), 4-12. doi: 10.1016/S2155-8256(23)00063-7; Lasater, K.B., Aiken, L.H., Sloane, D.M., et al. (2021) Chronic hospital nurse understaffing meets COVID-19: an observational study. BMJ Quality & Safety 30, 639-647; Al Sabei, S. D., Al‐Rawajfah, O., AbuAlRub, R., Labrague, L. J., & Burney, I. A. (2022). Nurses’ job burnout and its association with work environment, empowerment and psychological stress during COVID‐19 pandemic. International Journal of Nursing Practice, 28(5); Galanis, P., Vraka, I., Fragkou, D., Bilali, A., & Kaitelidou, D. (2021). Nurses’ burnout and associated risk factors during the COVID‐19 pandemic: A systematic review and meta‐analysis. Journal of advanced nursing, 77(8), 3286-3302; and Lopez, V., Anderson, J., West, S., & Cleary, M. (2022). Does the COVID-19 pandemic further impact nursing shortages?, Issues in Mental Health Nursing, 43(3), 293-295, doi: 10.1080/01612840.2021.1977875.
[22] International Council of Nurses. (2021). International Council of Nurses Policy Brief. The global nursing shortage and nursing retention. Retrieved from https://www.icn.ch/sites/default/files/inline-files/ICN%20Policy%20Brief_Nurse%20Shortage%20and%20Retention_0.pdf.
[23] U.S. Bureau of Labor Statistics. (August 29, 2024). Registered nurses, job outlook. Occupational Outlook Handbook. Bureau of Labor Statistics. Retrieved from https://www.bls.gov/ooh/healthcare/registered-nurses.htm#tab-6.
[24] U.S. Bureau of Labor Statistics. (August 29, 2024). Nurse Anesthetists, Nurse Midwives, and Nurse Practitioners, job outlook. Occupational Outlook Handbook. Bureau of Labor Statistics. Retrieved from https://www.bls.gov/ooh/healthcare/nurse-anesthetists-nurse-midwives-and-nurse-practitioners.htm#tab-6.
[25] AMN Healthcare. (2023). 2023 Survey of Registered Nurses. Retrieved from https://www.amnhealthcare.com/amn-insights/nursing/surveys/2023/.
[26] Ibid.
[27] SHRM Benchmarking: Talent Access Report. (2022). Society for Human Resource Management. Retrieved from https://www.shrm.org/content/dam/en/shrm/research/benchmarking/Talent%20Access%20Report-TOTAL.pdf..
[28] Trinkoff, A.M., Han, K., Storr, C.L., Lerner, N., Johantgen, M., Gartrell, K. (December 2013). Turnover, staffing, skill mix, and resident outcomes in a national sample of US nursing homes. JONA: The Journal of Nursing Administration 43(12):p 630-636. doi: 10.1097/NNA.0000000000000004.
[29] Yang, Y. T., & Mason, D. J. (2022, January 28). COVID-19’s impact on nursing shortages, the rise of travel nurses, and price gouging. Health Affairs Forefront. Retrieved from https://www.healthaffairs.org/do/10.1377/forefront.20220125.695159/.
[30] United States Government Accountability Office. (August 2024). Expanded use of supplemental nurses during the COVID-19 pandemic. GAO-24-106447. Retrieved from https://www.gao.gov/assets/gao-24-106447.pdf.
[31] Yang & Mason (2022), above, n. 29.
[32] C.J. Jones. (2005). The Costs of Nurse Turnover, pt 2: Application of the Nursing Turnover Costs Calculation Methodology. Journal of Nursing Administration 35(1), 41-9.
[33] Robertson, K. (January 13, 2008). Nurses (still) wanted. Sacramento Business Journal. Retrieved from http://www.bizjournals.com/sacramento/stories/2008/01/14/focus1.html.
[34] Bae, S. H. (2024). Nurse Staffing, Work Hours, Mandatory Overtime, and Turnover in Acute Care Hospitals Affect Nurse Job Satisfaction, Intent to Leave, and Burnout: A Cross-Sectional Study. International Journal of Public Health, 69:1607068. doi: 10.3389/ijph.2024.1607068.
[35] Kovner, C. T., Brewer, C. S., Fatehi, F., & Jun, J. (2014). What Does Nurse Turnover Rate Mean and What Is the Rate? Policy, Politics, & Nursing Practice, 15(3–4), 64–71. Accessed at https://doi.org/10.1177/1527154414547953
[36] McHugh, M. D., & Ma, C. (2014). Wage, Work Environment, and Staffing: Effects on Nurse Outcomes. Policy, Politics, & Nursing Practice, 15(3–4), 72–80. https://doi.org/10.1177/1527154414546868
[37] Aiken, L., et. al. (2010). [above, n.1].
[38] Sapatkin, D. (July 30, 2012). Penn Study Examines Link Between Nurse Burnout, Care. Philadelphia Inquirer. Retrieved from https://www.philly.com/philly/health/20120730_Penn_study_examines_link_between_nurse_burnout__care.html.
[39] Lasater K.B., Aiken, L.H., Sloane, D., et al. (2021). [above, n. 7].
[40] Everhart, D., Neff, D., Al-Amin, M., Nogle, J., & Weech-Maldonado, R. (2013). The effects of nurse staffing on hospital financial performance: competitive versus less competitive markets. Health Care Management Review 38(2), 146-55. Retrieved from https://www.ncbi.nlm.nih.gov/pmc/articles/PMC4543286/
[41] Minnesota Nursing Association. (2010). Fact Sheet: RN-to-Patient Staffing Ratios. Retrieved from http://mnnurses.files.wordpress.com/2010/03/staffing-ratios-fact-sheet.pdf.
[42] National Nurses United. (2011). The Evidence is In: RN-to-Patient Ratios Save Lives. Retrieved from http://www.nationalnursesunited.org/issues/entry/ratios.
[43] Barber, R., Kogan, A., Riffenburgh, A., & Enguidanos, S. (2015). A role for social workers in improving care setting transitions: A case study. Social Work Health Care 54(3): 177–192. doi:10.1080/00981389.2015.1005273.
[44] Falvey, J. R., Burke, R. E., Malone, D., Ridgeway, K. J., McManus, B. M., & Stevens-Lapsley, J. E. (2016). Role of Physical Therapists in Reducing Hospital Readmissions: Optimizing Outcomes for Older Adults During Care Transitions From Hospital to Community. Physical therapy 96(8), 1125-34. Retrieved from https://doi.org/10.2522/ptj.20150526.
[45] Tappenden, K.A., Quatrara, B., Parkhurst, M.L., Malone, A.M., Fanjiang, G., Ziegler, T.R. (2013). Critical role of nutrition in improving quality of care: an interdisciplinary call to action to address adult hospital malnutrition. Journal of parenteral and enteral nutrition 37(4),482-97. doi: 10.1177/0148607113484066.
[46] See, for example, Griffiths, P., Ball, J., Drennan, J., James, L., Jones, J., Recio-Saucedo, A., & Simon, M. (2014). The association between patient safety outcomes and nurse / healthcare assistant skill mix and staffing levels & factors that may influence staffing requirements. University of Southampton. Retrieved from https://eprints.soton.ac.uk/367526/1/Safe%2520nurse%2520staffing%2520of%2520adult%2520wards%2520in%2520acute%2520hospitals%2520evidence%2520review%25201.pdf; and Missed Care Study Group (2018). Nurse staffing, nursing assistants and hospital mortality: retrospective longitudinal cohort study. BMJ Quality & Safety. https://doi.org/10.1136/bmjqs-2018-008043.
[47] Price, C. (May 24, 2018). Nurses seek safe staffing at UVM Medical Center. Vermont Digger. Retrieved from https://vtdigger.org/2018/05/24/cristina-price-nurses-seek-safe staffing-uvm-medical-center/.
[48] Office and Professional Employees International Union. (October 3, 2024). Kapi’olani Nurses Vote Overwhelmingly to Ratify Historic New Contract. Retrieved from https://www.opeiu.org/Home/NewsandMedia/TabId/2838/ArtMID/4815/ArticleID/2848/Kapi%e2%80%99olani-Nurses-Vote-Overwhelmingly-to-Ratify-Historic-New-Contract.aspx.
[49] Ly, S. (October 13, 2024). United Health Professionals of New Mexico Ratify Contract Agreement. American Federation of Teachers. Retrieved from https://www.aft.org/press-release/united-health-professionals-new-mexico-ratify-contract-agreement.
[50] HPAE (June 13, 2024). HPAE Local 5030 Members Ratify Contract with HMH to Institute First Staffing Ratios in Hospital’s History. Retrieved from https://www.hpae.org/2024/06/hpae-local-5030-members-ratify-contract-with-hmh-to-institute-first-staffing-ratios-in-hospitals-history/.
[51] HPAE (June 6, 2024). Cooper, Englewood Nurses ratify enforceable safe staffing ratios, and economic gains. Retrieved from https://www.hpae.org/2024/06/cooper-englewood-nurses-ratify-enforceable-safe-staffing-ratios-and-economic-gains/
[52] IAM Healthcare. (January 3, 2024). Nearly 1,000 Health Care Workers at Ohio State University’s Wexner Medical Center Vote to Join IAM Union. Retrieved from https://iamhealthcarepros.org/organizing/nearly-1000-health-care-workers-at-ohio-state-universitys-wexner-medical-center-vote-to-join-iam-union/.
[53] Engel, C. (December 15, 2023). United Steelworkers. USW Nurses at Robert Wood Johnson Ratify Contract Securing Industry-Setting Staffing Standards. Retrieved from https://m.usw.org/news/media-center/releases/2023/usw-nurses-at-robert-wood-johnson-ratify-contract-securing-industry-setting-staffing-standards.
[54] Oregon Nurses Association. (October 5, 2023). AURN Tentative Agreement Ratified: New Contract Goes into Effect November 6th! Retrieved from https://www.oregonrn.org/blogpost/2050183/494312/AURN-Tentative-Agreement-Ratified-New-Contract-Goes-into-Effect-November-6th.
[55] Oregon Nurses Association. Safe Staffing Saves Lives: Amended Bill Overview. Retrieved from https://www.oregonrn.org/page/SafeStaffing-AmendedBill.
[56] Ibid.
[57] New York S3691 Enacts the “safe staffing for quality care act.” Trackbill. Retrieved from https://trackbill.com/bill/new-york-senate-bill-3691-enacts-the-safe-staffing-for-quality-care-act/387457/.
[58] Massachusetts Nurses Association. News and Information on the New Law for Safe Patient Limits in ICUs. Retrieved from https://www.massnurses.org/legislation-politics/safe-patient-limits/safe-patient-limits-in-icus/#bill.
[59] Roberts, A. (October 3, 2023). Nurse-Patient Ratios: These States Have These Controversial Policies in Place. Nurse Journal. Retrieved from https://nursejournal.org/articles/nurse-patient-ratios/. See also de Cordova, P. B., Rogowski, J., Riman, K. A., & McHugh, M. D. (2019). Effects of Public Reporting Legislation of Nurse Staffing: A Trend Analysis. Policy, Politics, & Nursing Practice. https://doi.org/10.1177/1527154419832112
[60] Ohio Nurses Association. (June 7, 2018). Ohio Nurses Association Applauds Passage of House Bill 456 - Prohibit Requiring Nurses to Work Overtime. Retrieved from https://www.prnewswire.com/news-releases/ohio-nurses-association-applauds-passage-of-house-bill-456--prohibit-requiring-nurses-to-work-overtime-300662044.html.
[61] Ballotpedia. (2018). Massachusetts Question 1, Nurse-Patient Assignment Limits Initiative. Retrieved from https://ballotpedia.org/Massachusetts_Question_1,_Nurse-Patient_Assignment_Limits_Initiative_(2018).
[62] Federal Register. (May 10, 2024). Medicare and Medicaid Programs; Minimum Staffing Standards for Long-Term Care Facilities and Medicaid Institutional Payment Transparency Reporting. Retrieved from https://www.federalregister.gov/documents/2024/05/10/2024-08273/medicare-and-medicaid-programs-minimum-staffing-standards-for-long-term-care-facilities-and-medicaid.
School Administrators: An Occupational Overview
Fact Sheet 2024
Highlights
School administrators who belong to unions usually have higher salaries and better benefits than those who do not. In 2023, school administrators who were union members made 21 percent more than non-union school administrators.
In 2023, there were approximately 993,000 school administrators working in the United States, a net increase of 23.5 percent from ten years prior.
School administrators have been faced with an increasingly diverse set of challenges, including growing pressure to meet state-mandated assessments, as well as concerns about chronic student absenteeism, student mental health and wellness, and school safety amidst a sharp increase in gun violence.
Introduction
From college deans to high-school principals to private day-care directors, school administrators are tasked with providing essential educational, curricular, and financial leadership, as well as ensuring the smooth day-to-day operations of our nation’s public and private educational institutions. As the professionals tasked with effectively managing thousands of colleges, universities, primary and secondary schools and other educational organizations, school administrators must react quickly to keep up with changing educational standards and expectations.
This fact sheet reviews general workforce information about school administrators, including their educational background, demographic information, trends in wages, union membership and benefits, and the challenges many of them face on the job.
School Administrators and Student Enrollment
In 2023, there were approximately 993,000 school administrators working in the United States, including 512,000 principals and other administrators at elementary and secondary schools, 326,000 administrators at colleges and universities, 97,000 at child and day care providers and 58,000 at trade schools and other educational service providers.[1] This represents a 4 percent increase from the number of school administrators in 2018, and a 23.5 percent increase from 2013.[2]
Elementary and secondary schools
In elementary and secondary schools, the average student-to-administrator ratio for the 2022-2023 school year in the U.S. was 252:1.[3]
Enrollment in elementary and secondary schools in Fall 2023 totaled 54.8 million students, including 49 million public school students and 5.8 million private school students. Enrollment in elementary and secondary schools experienced net decreases of 2.6 percent over the past five years and 1.1 percent over the past decade.[4] Total student enrollment in elementary and secondary schools peaked in Fall 2019, before the COVID-19 pandemic disrupted school systems across the country.
Postsecondary institutions
In 2022, in degree-granting postsecondary institutions, the average ratio of full-time equivalent (FTE) students to FTE non-instructional staff was approximately 8:1. However, the table below reveals that the ratios vary according to the sector of postsecondary institutions. Private nonprofit institutions had the lowest ratio of FTE students to staff, and for-profit institutions had the highest.
|
Number of full-time equivalent students (FTE) per FTE non-instructional staff in postsecondary institutions, Fall 2022 |
|
|
School sector |
Ratio |
|
Public |
8.3 |
|
Private Nonprofit |
5.8 |
|
For-profit |
19.4 |
Spring 2024 enrollment of full- and part-time students at postsecondary institutions totaled 17.8 million, a 2.6 percent increase from the previous year.[6] Enrollment in higher education institutions has generally been declining since 2010, when enrollment peaked at 18.1 million.
Education and Experience of School Administrators
Many K-12 school districts and private schools require principals, assistant principals, and other administrators to have at least a master’s degree in school administration or a related field. The 2020-2021 National Teacher and Principal Survey (NTPS) reported that only 2 percent of public school K-12 principals had a bachelor’s degree or less. There were 62 percent of principals in this category with a master’s degree, and 36 percent had a professional diploma, doctorate, or other professional degree. Significantly higher percentages of principals working in private schools (28 percent) and schools with less than 100 students (6.3 percent) had only a bachelor’s degree.[7]
In higher education, where administrator positions range in responsibility and seniority, bachelor’s degree holders made up 28 percent of the school administrator population in 2023, master’s degree holders made up 44 percent, and doctorate degree holders made up 13 percent.[8] Administration jobs at day care centers and preschools are the least likely to require advanced degrees, and significant numbers of these jobs may not require bachelor’s degrees at all.
Most public school principals and administrators need at least a few years of experience as teachers before moving into school leadership positions.[9] On average, public school principals have 12 years of teaching experience, and private school principals have 14.[10]
During the 2021-2022 school year, 17 percent of all master’s degrees granted were in education, second only to business degrees. While not all recipients entered administrative positions afterwards, this number is likely influenced by the degree requirements shared by administrators and teachers in many states.[11]
Demographics of School Administrators
In 2023, 15.5 percent of school administrators identified as Black or African American, indicating that this demographic population was slightly overrepresented in this occupation compared to representation in the total U.S. workforce (12.8 percent of the workforce identified as Black or African American). Conversely, only 12 percent of school administrators identified as Hispanic or Latino in 2023, making this group underrepresented in this occupation (18.8 percent of the U.S. workforce identified as Hispanic or Latino). School administrators who identified as Asian American or Pacific Islander were also slightly underrepresented; while they made up 5.7 percent of school administrators, they were 6.9 percent of the total workforce.[12]
In 2023, approximately 69 percent of all school administrators were women, making them overrepresented when compared to the total U.S. workforce, which was 47 percent women. School administrators identifying as women were even more disproportionately represented in day care and preschool establishments, where 98 percent of administrators were women. Women made up 64 percent of elementary and secondary school administrators, 71 percent of college and university administrators, and 60 percent of business, technical and trade school administrators.[13]
During the 2020-2021 school year, women made up 56 percent of public school principals. They were most likely to be in these positions in elementary schools, where they comprised almost 69 percent of principals. That school year, men made up 64.5 percent of high school principals and about 56 percent of middle school principals.[14]
Wages and Benefits of School Administrators
Wages vary by industry for school administrators, with K-12 and higher education administrators making comparable salaries, and administrators of day care centers and preschools making significantly less.
|
Average Yearly Earnings for School Administrators, by detailed industry, sex and union membership, 2023 |
|
|
All School Administrators |
$ 95,990 |
|
Male |
$ 107,706 |
|
Female |
$ 79,985 |
|
Elementary and Secondary Schools |
$ 96,515 |
|
Male |
$ 114,042 |
|
Female |
$ 86,711 |
|
Colleges and Universities |
$ 88,561 |
|
Male |
$ 105,607 |
|
Female |
$ 80,598 |
|
Child Day Care and Preschools |
$ 55,724 |
|
Male |
$ 52,312 |
|
Female |
$ 55,590 |
|
Union Members |
$ 107,163 |
|
Non-Union Members |
$ 84,817 |
U.S. Census Bureau. Current Population Survey Microdata. 2023. Reported weekly pay averages were multiplied by 52 to extrapolate yearly average salaries.
Significant gender pay gaps exist among school administrators. This can be partly explained by the overrepresentation of women in lower-paying sectors like child day care and preschool administration, as well as the underrepresentation of women in higher-paying administrative positions in higher education.[16]
It is also important to note the pay differentials that exist within sectors. For example, during the 2020-2021 school year, high school principals made on average 6.5 percent more than elementary school teachers.[17] And within higher education, the occupational classification of “education administrator” encompasses a wide range of positions, from executive-level provosts, deans and vice-presidents to mid-level managers and administrators in smaller departments, including financial aid, admissions, registrar’s offices and student affairs.[18]
The Union Advantage
In 2023, 15.7 percent of school administrators were union members.[19]
On average, school administrators who belong to unions have higher salaries and better benefits than those who do not. In 2023, school administrators who belonged to unions reported a mean weekly salary of $2,061, while non-union administrators earned $1,631,[20] a 21 percent difference in earnings.
The union wage differential was similar for those working in elementary and secondary schools, where 24 percent of administrators were union members in 2023.[21] Union administrators working in elementary and secondary schools reported average weekly earnings of $2,205 while non-members reported average weekly earnings of $1,741.[22]
The American Federation of School Administrators (AFSA), established in 1976, is the leading union representing public school principals, vice principals, administrators, and supervisors. In addition to offering professional and occupational services, AFSA offers member benefits, insurance, and a scholarship program.[23]
School administrators belonging to unions can increase their skills and efficiency by attending union-sponsored workshops and seminars. For example, Local 1 of AFSA, the Council of School Supervisors & Administrators in New York, offers a variety of professional workshops and seminars aimed at improving educational leadership, from conflict resolution and student achievement strategies to data management strategies.[24]
School administrators joining in union with AFSA
Over the past few years, there has been an upsurge in organizing across the U.S. School administrators have been a part of this trend, especially since the start of the COVID-19 pandemic, when school leaders were faced with severe challenges in their schools and communities. A growing number of school administrators have joined in union with AFSA for better pay, benefits, and working conditions. Below is a select list of school administrators who have recently joined in union with AFSA.
Principals and assistant principals at the Sweetwater Union High School District in Chula Vista, California (2024)
Principals, assistant principals and school district administrators in Montgomery County, Maryland, formerly part of the Montgomery County Association of Administrators and Principals (2023).
Principals and assistant principals in Chicago’s public schools (2023). This group was able to join in union after the passage of an Illinois state law in early 2023, which granted collective bargaining rights to school administrators in Chicago.
School administrators in Rochester, Minnesota (2022).
School administrators in Meriden and Lebanon, Connecticut (2022).
K-12 Administrators: Changing Roles and Persistent Challenges
Once viewed strictly as disciplinarians and operational managers, the role of K-12 principals and other administrators has changed significantly over the past decades. Driven by federal policies, the rise of high-stakes school testing and a growing emphasis on school performance has brought new attention to the critical role that school administrators play in developing curricula, setting teaching standards, and building an environment conducive to high-quality education.[25] The importance of having prepared, confident, and well-supported administrators cannot be overstated. Especially in lower-performing schools and schools with limited resources, having effective school leadership provides the greatest impact in supporting positive educational environments.[26]
One of the main ways administrators impact student achievement is through shaping the school climate for teachers and students. In 2018, University of Chicago researchers found that by fostering “safe, supportive environments with high, consistent and clear expectations for students,” all teachers and students were able to be much more successful on a collective level than they were individually without schoolwide support systems.[27]
Beginning in early 2020, the COVID-19 pandemic severely disrupted school systems across the country. School administrators needed to navigate the establishment of new health and safety precautions and learning environments, including obtaining and distributing resources for distance learning (if their schools implemented such practices) and overseeing school COVID-19 testing programs. Additionally, some found themselves needing to fill in for teaching and support staff due to staffing shortages.
Prior to the pandemic, school administrators had already been experiencing increasing pressure to meet state-mandated assessments. The pandemic negatively impacted student performance, leading to declining test scores. As of this writing, the lingering effects of the pandemic have continued to negatively impact student performance in both mathematics and English language arts subjects to a greater degree in schools with a majority (76 percent or more) of students of color, in schools located in high-poverty areas, and in schools in the Western region of the U.S.[28]
In 2024, the National Center for Education Statistics’ School Pulse Panel survey revealed that 83 percent of public school leaders indicated that “the COVID-19 pandemic and its lingering effects continue to negatively impact the socioemotional development of students.”[29] AFSA works with its members to foster supportive mental health environments in schools, develop social and emotional learning curricula, and support the mental health and wellness of school administrators.[30]
Closely related to concerns about students meeting academic standards is the growing issue of chronic absenteeism (missing 10% or more of school per year), especially in the wake of the COVID-19 pandemic. Data from the U.S. Department of Education reveals that chronic absenteeism increased to almost 30 percent during the 2021-2022 school year from 16 percent before the pandemic, and 43 percent of schools had extreme levels of chronic absenteeism.[31] The highest rates of chronic absenteeism exist among students in poverty, schools serving greater proportions of non-white students, students with disabilities, and English-language learners.[32]
Issues with school discipline further challenge school administrators. Previous studies have found that almost half of public school administrators believe they spend a disproportionate amount of time managing disciplinary issues.[33] Further analysis found that spending more time on school organization and management (staff and budget management) compared to school administration (including student discipline) is most closely linked to improving test scores and improving school climate ratings from staff and parents.[34]
The safety of students, staff, and school administrators has been a growing concern, as record high instances of school shootings and other violent threats were reported in the U.S. in 2023.[35] AFSA has supported the demands of March for Our Lives, a student-led movement that advocates for gun control legislation and related measures, including universal background checks and increased federal funding for mental health services in schools.[36] School administrators have also experienced a growing number of threats against them, mainly from parents. AFSA also advocates for increased support and prevention against violent threats to school leaders.[37]
—————-
[1] U.S. Census Bureau. Current Population Survey Microdata. 2023. Retrieved from https://data.census.gov/mdat.
[2] “Table 11. Employed persons by detailed occupation, sex, race, and Hispanic or Latino ethnicity.” (2018 and 2013). Current Population Survey Labor Force Statistics. Retrieved from https://www.bls.gov/cps/cpsaat11.htm.
[3] Elementary / Secondary Information System, 2022-2023. National Center for Education Statistics. Retrieved from https://nces.ed.gov/ccd/elsi/tableGenerator.aspx.
[4] “Table 105.30: Enrollment in elementary, secondary, and degree-granting postsecondary institutions, by level and control of institution: Selected years, 1869-70 through fall 2031.” Digest of Education Statistics. National Center for Education Statistics. Retrieved from https://nces.ed.gov/programs/digest/d22/tables/dt22_105.30.asp.
[5] “Table 314.10. Total and full-time-equivalent (FTE) staff and FTE student/FTE staff ratios in postsecondary institutions participating in Title IV aid programs, by degree-granting status, control of institution, and primary occupation: Fall 1999, fall 2009, and fall 2022.” In Integrated Postsecondary Education Data System. National Center for Education Statistics. Retrieved from https://nces.ed.gov/programs/digest/d23/tables/dt23_314.10.asp. Note that this ratio includes many staff members who could be considered administrators and many who would be classified in other occupations.
[6] Current Term Enrollment Estimates: Spring 2024. National Student Clearinghouse Research Center (May 22, 2024). Retrieved from https://nscresearchcenter.org/current-term-enrollment-estimates/.
[7] “Table A-3. Principals’ highest degree earned: Percentage distribution of K–12 school principals, by highest degree earned, school type, and selected school characteristics: 2020–21.” In Taie, S., and Lewis, L. (2022). Characteristics of 2020–21 Public and Private K–12 School Principals in the United States: Results From the National Teacher and Principal Survey First Look (NCES 2022-112). U.S. Department of Education. Washington, DC: National Center for Education Statistics. Retrieved from https://nces.ed.gov/pubsearch/pubsinfo.asp?pubid=2022112.
[8] U.S. Census Bureau. Current Population Survey Microdata. 2023.
[9] “How to Become an Elementary, Middle or High School Principal.” Occupational Outlook Handbook. Bureau of Labor Statistics. Retrieved from https://www.bls.gov/ooh/management/elementary-middle-and-high-school-principals.htm#tab-4.
[10] Hill, J., Ottem, R. & DeRoche, J. (2016, April). Trends in public and private school principal demographics and qualifications: 1987-88 to 2011-12. National Center for Education Statistics. Retrieved from https://nces.ed.gov/pubs2016/2016189.pdf.
[11] Irwin, V., Wang, K., Jung, J., Kessler, E., Tezil, T., Alhassani, S., Filbey, A., Dilig, R., and Bullock Mann, F. (2024). Report on the Condition of Education 2024 (NCES 2024-144). U.S. Department of Education. Washington, DC: National Center for Education Statistics. Retrieved from https://nces.ed.gov/pubsearch/pubsinfo.asp?pubid=2024144.
[12] “Table 11. Employed persons by detailed occupation, sex, race, and Hispanic or Latino ethnicity.” (2023). Current Population Survey Labor Force Statistics.
[13] Ibid.
[14] “Table A-2. Principals’ age and sex: Average and median age of K–12 school principals and percentage distribution of principals, by age category, sex, school type, and selected school characteristics: 2020–21.” In Taie, S., and Lewis, L. (2022). Characteristics of 2020–21 Public and Private K–12 School Principals in the United States. Retrieved from
https://nces.ed.gov/pubsearch/pubsinfo.asp?pubid=2022112.
[15] U.S. Census Bureau. Current Population Survey Microdata. 2023. Reported weekly pay averages were multiplied by 52 to extrapolate yearly average salaries.
[16] Bichel, J. & McChesney, J. (2017, February). The gender pay gap and the representation of women in higher education administrative positions: The century so far. College and University Professional Association for Human Resources. Retrieved from https://www.cupahr.org/wp-content/uploads/cupahr_research_brief_1.pdf.
[17] “Table A-4. Principals’ average annual salary: Average annual salary for K–12 school principals, by years of experience as a principal, school type, and selected school characteristics: 2020–21.” In Taie, S., and Lewis, L. (2022). Characteristics of 2020–21 Public and Private K–12 School Principals in the United States. Retrieved from
https://nces.ed.gov/pubsearch/pubsinfo.asp?pubid=2022112.
[18] “What postsecondary education administrators do.” Occupational Outlook Handbook. Bureau of Labor Statistics. Retrieved from https://www.bls.gov/ooh/management/postsecondary-education-administrators.htm#tab-2.
[19] U.S. Census Bureau. Current Population Survey Microdata. 2023.
[20] Ibid.
[21] Ibid.
[22] Ibid.
[23] American Federation of School Administrators (AFSA). Retrieved from https://www.theschoolleader.org/.
[24] Executive Leadership Institute, Council of School Supervisors and Administrators, ASFA Local 1. Retrieved from https://elipd.org/.
[25] Kominiak, T. The changing role of the school principal. trustED. K12 Insight. Retrieved from https://www.k12insight.com/trusted/changing-role-school-principal-2/.
[26] Leithwood, K., Louis, K., Anderson, S., & Wahlstrom, K. (September 2004). How leadership influences student learning. Center for Applied Research and Educational Improvement. Retrieved from https://www.wallacefoundation.org/knowledge-center/Documents/How-Leadership-Influences-Student-Learning.pdf
[27] Allensworth, E.M., & Hart, H. (2018). How do principals influence student achievement? Chicago, IL: University of Chicago Consortium on School Research. Retrieved from https://consortium.uchicago.edu/sites/default/files/2018-10/Leadership%20Snapshot-Mar2018-Consortium.pdf.
[28] “Most Schools Report Some Concern About Students Meeting Academic Standards and Issues Related to Staffing Shortages.” (April 16, 2024). National Center for Education Statistics. Retrieved from https://nces.ed.gov/whatsnew/press_releases/4_16_2024.asp.
[29] “About One-Quarter of Public Schools Reported That Lack of Focus or Inattention From Students Had a Severe Negative Impact on Learning in 2023-24.” (July 18, 2024). National Center for Education Statistics. Retrieved from https://nces.ed.gov/whatsnew/press_releases/7_18_2024.asp.
[30] American Federation of School Administrators. (May 30, 2022). Resolution 8 — School Leader Wellness Support. Retrieved from
https://www.theschoolleader.org/our-positions/resolution-8-school-leader-wellness-support.
[31] Chang, Hedy, et al. “Rising Tide of Chronic Absence Challenges Schools.” (October 12, 2023). Attendance Works. Retrieved from https://www.attendanceworks.org/rising-tide-of-chronic-absence-challenges-schools/.
[32] “All Hands on Deck: Today’s Chronic Absenteeism Requires A Comprehensive District Response and Strategy.” (November 17, 2023). Attendance Works. Retrieved from https://www.attendanceworks.org/todays-chronic-absenteeism-requires-a-comprehensive-district-response-and-strategy/. See also “Overcoming Chronic Absenteeism: Solutions for School Leaders.” (February 27, 2024). American Federation of School Administrators. Retrieved from https://www.youtube.com/watch?v=4XXCHF4d268.
[33] U.S. Government Accountability Office. (2001). Student discipline: Individuals with disabilities education act. Retrieved from http://www.gao.gov/new.items/d01210.pdf.
[34] Horng, E. L., Klasik, D., & Loeb, S. (2010). Principal’s Time Use and School Effectiveness. American Journal of Education, 116 (4), 491–523.
[35] Hurst, Kiley. “About 1 in 4 U.S. teachers say their school went into a gun-related lockdown in the last school year.” (April 11, 2024). Pew Research Center. Retrieved from https://www.pewresearch.org/short-reads/2024/04/11/about-1-in-4-us-teachers-say-their-school-went-into-a-gun-related-lockdown-in-the-last-school-year/.
[36] American Federation of School Administrators. (October 17, 2018). March for Our Lives Resolution. Retrieved from https://www.theschoolleader.org/march-our-lives-resolution; and American Federation of School Administrators. (2018, October 17, 2018). Empowering greater school safety. Retrieved from https://www.theschoolleader.org/our-positions/empowering-greater-school-safety.
[37] American Federation of School Administrators. (May 30, 2022). Resolution 1 – Threats and Assaults Against School Supervisors and Administrators. Retrieved from https://www.theschoolleader.org/our-positions/resolution-1-threats-and-assaults-against-school-supervisors-and-administrators.Download the PDF Version
The Professional and Technical Workforce: By the Numbers
2024 FACT SHEET
Highlights
Professionals were 57.8 percent of the total workforce in 2023, with 93 million people working across a wide variety of occupations.
6.44 million union members worked in professional occupations in 2023, an all-time high.
Professionals who identify as women as well as those who identify as Black or African American continued to be underrepresented in some of the highest paying professional occupational groups, including management occupations and architecture and engineering occupations.
Quantifying the Professional and Technical Workforce
While the professional and technical workforce can be hard to define, available data demonstrates that professionals play a greater part in our economy than ever before. Over the past few decades, the increase in the number of professionals has created interest in analysis of professionals and the unique issues they face in the workplace. While professional jobs are diverse, professionals often have a strong occupational identity, advanced education and training, and above average compensation.
The U.S. Bureau of Labor Statistics (BLS) defines the professional workforce as including all workers in the “management, professional, and related occupations” group. The BLS goes on to divide this broad category into 10 distinct occupation groups. These groups, and the number of people who worked in them in 2023, include:
Management occupations (20,906,000);
Business and financial operations occupations (9,638,000);
Computer and mathematical occupations (6,502,000);
Architecture and engineering occupations (3,602,000);
Life, physical, and social science occupations (1,870,000);
Community and social service occupations (2,879,000);
Legal occupations (1,897,000);
Education, training, and library occupations (9,403,000);
Arts, design, entertainment, sports, and media occupations (3,478,000); and
Healthcare practitioner and technical occupations (10,099,000).[1]
In total, there were 70,274,000 professionals working in these occupations in 2023, representing about 44 percent of the total U.S. workforce.
However, a number of professionals are employed in occupations that are not included in the BLS classification of “management, professional, and related occupations,” due to the way the Standard Occupational Classification (SOC) system was constructed. For example, the “sales and office occupations” group includes many professionals who are well-educated and may be well-compensated, including securities, commodities and financial services sales agents, and accounting clerks. The same is true in nearly every other occupational group, including firefighters and fire inspectors in the protective service occupations group and aircraft pilots and flight engineers in the transportation occupations group.
Therefore, the second way to identify who is a professional is through educational attainment. This method for identifying professionals also has flaws, since it would also count those who are underemployed in occupations that would not be considered to be part of the professional or technical workforce. However, given the fluidity of professional identity, and absent other methods to count all professionals, this fact sheet counts employees in all occupation groups as professionals if they have at least an associate’s degree in an academic program. Thus, professional employment outside of the professional occupation groups in 2023 totaled 22,816,000, including:
Healthcare support occupations (1,468,000);
Protective service occupations (1,340,000);
Food preparation and serving related occupations (1,264,000);
Building and grounds cleaning and maintenance occupations (758,000);
Personal care and service occupations (1,281,000);
Sales and related occupations (5,890,000);
Office and administrative support occupations (6,163,000);
Farming, fishing, and forestry occupations (151,000);
Construction and extraction occupations (1,139,000);
Installation, maintenance, and repair occupations (895,000);
Production occupations (1,510,000); and
Transportation and material moving occupations (2,096,000).[2]
Using these two methods, we can count over 93 million professionals working in the U.S. in 2023, making up 57.8 percent of the total workforce.
The third and final definition of a professional includes all working people who self-identify as professionals. However, as this definition is not quantifiable, it will not be included in this factsheet.
Demographic Characteristics of Professionals
Professionals who identify as women
In 2023, 51.8 percent of professional occupations were held by women.[3] However, the representation of women across all occupations was not distributed equally. When compared to the percentage of women in the total workforce in 2023 (46.9 percent), women were overrepresented by more than three percentage points in nine out of 22 occupational groups (five of which are professional occupation groups according to the BLS), and underrepresented by more than three percentage points in ten out of 22 occupational groups (three of which are professional occupation groups). Between 2013 and 2023, the representation of women in most professional occupation groups increased, though they are still underrepresented in some of the highest paying professional occupation groups, including management, computer and mathematical science, and architecture and engineering occupations.
|
Occupation Group |
2023 Percentage Women |
2013 Percentage Women |
|
Professional Occupation Groups |
||
|
Management |
41.9% |
38.2% |
|
Business and Financial Operations |
54% |
55.7% |
|
Computer and Mathematical Science |
26.9% |
26.1% |
|
Architecture and Engineering |
16.7% |
14.1% |
|
Life, Physical, and Social Science |
49.8% |
46.1% |
|
Community and Social Service |
69.6% |
62.3% |
|
Legal |
52.1% |
50.8% |
|
Education, Training, and Library |
72.8% |
73.8% |
|
Arts, Design, Entertainment, Sports, and Media |
48% |
47.2% |
|
Healthcare Practitioner and Technical |
75.9% |
74.4% |
|
Non-professional Occupation Groups |
||
|
Healthcare Support |
84.3% |
88.9% |
|
Protective Service |
24.1% |
21.1% |
|
Food Preparation and Serving Related |
53.9% |
54.7% |
|
Building and Grounds Cleaning and Maintenance |
42.1% |
38.7% |
|
Personal Care and Service |
74.8% |
77.7% |
|
Sales and Related |
48.7% |
48.6% |
|
Office and Administrative Support |
71.2% |
73.3% |
|
Farming, Fishing, and Forestry |
27.1% |
21.7% |
|
Construction and Extraction |
4.3% |
2.6% |
|
Installation, Maintenance, and Repair |
4.1% |
4.2% |
|
Production Occupations |
29.9% |
27.6% |
|
Transportation and Material Moving |
21.4% |
15.5% |
Professionals who identify as Black or African American
In 2023, 10.6 percent of professional occupations were held by people who identify as Black or African American. When compared to the representation of this demographic in the total workforce in 2023 (12.8 percent), Black professionals were overrepresented by more than three percentage points in four out of 22 occupational groups (including one professional occupation group), and underrepresented by more than three percentage points in eight groups (five of which are professional occupation groups).[4] The table below reveals that between 2013 and 2023, the representation of this demographic population increased in all ten professional occupation groups. However, professionals who identified as Black or African American were still underrepresented in half of the professional occupation groups in 2023 – an indication of occupational segregation, which contributes to racial income inequality.[5]
|
Occupation Group |
2023 Percentage Black or African American |
2013 Percentage Black or African American |
|
Professional Occupation Groups |
||
|
Management |
9.2% |
6.5% |
|
Business and Financial Operations |
11.0% |
9.4% |
|
Computer and Mathematical Science |
9.2% |
8.3% |
|
Architecture and Engineering |
6.1% |
5.5% |
|
Life, Physical, and Social Science |
8.2% |
5.6% |
|
Community and Social Service |
19.6% |
18.6% |
|
Legal |
10.0% |
6.2% |
|
Education, Training, and Library |
11.2% |
9.4% |
|
Arts, Design, Entertainment, Sports, and Media |
9.6% |
6.5% |
|
Healthcare Practitioner and Technical |
13.5% |
10.5% |
|
Non-professional Occupation Groups |
||
|
Healthcare Support |
25.0% |
26.4% |
|
Protective Service |
22.3% |
18.6% |
|
Food Preparation and Serving Related |
13.5% |
12.2% |
|
Building and Grounds Cleaning and Maintenance |
14.3% |
14.6% |
|
Personal Care and Service |
13.5% |
14.6% |
|
Sales and Related |
11.7% |
10.4% |
|
Office and Administrative Support |
15.1% |
13.1% |
|
Farming, Fishing, and Forestry |
5.1% |
5.6% |
|
Construction and Extraction |
7.2% |
6.2% |
|
Installation, Maintenance, and Repair |
9.4% |
8.5% |
|
Production Occupations |
14.7% |
12.3% |
|
Transportation and Material Moving |
20.1% |
17.4% |
Professionals who identify as Hispanic or Latino
Between 2013 and 2023, there was a 73 percent increase in the number of professional occupations held by people who identify as Hispanic or Latino. In 2023, 11.2 percent of professional occupations were held by people who identify as Hispanic or Latino, up from 8.3 percent density in 2013. However, because people identifying as Hispanic or Latino comprised 18.8 percent of the total workforce in 2023, they were underrepresented by more than three percentage points in all ten professional occupation groups, and overrepresented by more than three percentage points in six non-professional occupation groups.[6]
|
Occupation Group |
2023 Percentage Hispanic or Latino (any race) |
2013 Percentage Hispanic or Latino (any race) |
|
Professional Occupation Groups |
||
|
Management |
12.1% |
8.5% |
|
Business and Financial Operations |
11.2% |
8.3% |
|
Computer and Mathematical Science |
8.8% |
6.3% |
|
Architecture and Engineering |
10.1% |
7.5% |
|
Life, Physical, and Social Science |
9.9% |
7.9% |
|
Community and Social Service |
14.5% |
10.0% |
|
Legal |
9.7% |
8.2% |
|
Education, Training, and Library |
12.1% |
9.6% |
|
Arts, Design, Entertainment, Sports, and Media |
13.0% |
8.4% |
|
Healthcare Practitioner and Technical |
9.5% |
7.4% |
|
Non-professional Occupation Groups |
||
|
Healthcare Support |
21.2% |
16.0% |
|
Protective Service |
16.1% |
15.1% |
|
Food Preparation and Serving Related |
29.6% |
24.4% |
|
Building and Grounds Cleaning and Maintenance |
41.6% |
35.9% |
|
Personal Care and Service |
19.8% |
16.9% |
|
Sales and Related |
19.8% |
14.5% |
|
Office and Administrative Support |
16.6% |
14.4% |
|
Farming, Fishing, and Forestry |
44.6% |
42.8% |
|
Construction and Extraction |
40.8% |
31% |
|
Installation, Maintenance, and Repair |
21.6% |
17.0% |
|
Production Occupations |
25.6% |
22.5% |
|
Transportation and Material Moving |
24.8% |
21.3% |
Professionals who identify as Asian American or Pacific Islander
In 2023, 9.3 percent of professional occupations were held by people who identified as Asian American or Pacific Islander (AAPI). While Asian Americans and Pacific Islanders made up only 6.9 percent of the total U.S. workforce that year, there have been large and growing concentrations of AAPI professionals in several professional occupation groups, including computer and mathematical sciences, architecture and engineering, and life, physical, and social sciences.[7] However, AAPI professionals are significantly underrepresented in many non-professional occupation groups, including protective service occupations, building and grounds cleaning and maintenance occupations, farming, fishing and forestry occupations, installation, maintenance and repair occupations, and construction and extraction occupations.
|
Occupation Group |
2023 Percentage Asian American or Pacific Islander |
2013 Percentage Asian American or Pacific Islander |
|
Professional Occupation Groups |
||
|
Management |
7.0% |
5.4% |
|
Business and Financial Operations |
8.6% |
7.7% |
|
Computer and Mathematical Science |
24.0% |
18.5% |
|
Architecture and Engineering |
13.1% |
11.3% |
|
Life, Physical, and Social Science |
16.5% |
11.8% |
|
Community and Social Service |
3.9% |
2.9% |
|
Legal |
4.4% |
4.9% |
|
Education, Training, and Library |
5.7% |
4.5% |
|
Arts, Design, Entertainment, Sports, and Media |
6.7% |
5.0% |
|
Healthcare Practitioner and Technical |
9.5% |
9.3% |
|
Non-professional Occupation Groups |
||
|
Healthcare Support |
7.6% |
4.7% |
|
Protective Service |
3.2% |
2.4% |
|
Food Preparation and Serving Related |
6.9% |
5.7% |
|
Building and Grounds Cleaning and Maintenance |
2.7% |
3.4% |
|
Personal Care and Service |
10.5% |
9.0% |
|
Sales and Related |
6.1% |
5.6% |
|
Office and Administrative Support |
5.0% |
4.3% |
|
Farming, Fishing, and Forestry |
0.9% |
1.8% |
|
Construction and Extraction |
1.3% |
1.6% |
|
Installation, Maintenance, and Repair |
2.9% |
3.2% |
|
Production Occupations |
5.4% |
6.3% |
|
Transportation and Material Moving |
4.4% |
3.1% |
Educational Attainment
In 2023, out of the 93 million working professionals, 68 million (73 percent) had a bachelor’s degree or higher. Life, physical, and social science occupations had the highest concentration of workers with a bachelor’s degree or higher (85.6 percent), followed by legal occupations (84.1 percent) and education, training, and library occupations (77.6 percent). Among BLS-designated professional occupations, management occupations had the lowest concentration of professionals with at least a bachelor’s degree at 58.7 percent.[8]
Certain occupational groups also have high concentrations of professionals with master’s, professional, and doctorate degrees, due to the education requirements of jobs within those categories or the advancement opportunities available to professionals with advanced degrees. For example, in 43 states, lawyers must earn a law degree from an accredited law school in order to practice, and earning a Juris Doctor is the most straightforward path to becoming an attorney, even in states where it is not required in order to pass the bar.[9]

Age
Older Professionals
In 2023, there were approximately 99.7 million Americans aged 55 or older, and there were 37.4 million people in this age group who were part of the workforce.[10] This age group includes members of the so-called “Silent Generation” (born before 1945), “Baby Boomers” (born between 1946-1964) and the oldest members of “Generation X” (born between 1965-1979).
Among people aged 55 or older, there were approximately 16.7 million people employed in professional occupations in 2023, comprising 23.8 percent of all professional occupations (compared to 23.2 percent of the total workforce).[11] This age group had particularly high rates of representation in management occupations, legal occupations (both professional occupation groups), and building and grounds cleaning and maintenance occupations in 2023. They were underrepresented in computer and math occupations (professional occupation group), food preparation and serving occupations, and protective service occupations, the latter of which is likely a result of relatively low retirement ages for law enforcement officers and firefighters in many states (due to mandatory retirement laws) and the robust pension plans that are often negotiated by their unions.[12]
Baby Boomers have been waiting longer than previous generations to leave the labor force. A 2018 Gallup survey showed that working Americans expect, on average, to retire at 66, two years later than they reported 15 years ago. And Baby Boomers, who may have a more realistic picture of their retirement savings needs, reported that they expect to work until age 67, even longer than the rest of the population.[13] However, the COVID-19 pandemic compelled some to retire earlier than previously planned. The number of Baby Boomers who retired in 2020 was more than double the number who retired in 2019.[14]
Baby Boomers are working longer than previous generations due to a multitude of factors, including longer life expectancies, changing eligibility requirements for Social Security benefits, and rising healthcare and long-term care costs, which increases the need for substantial retirement savings. And with the shift from employer-sponsored defined-benefit pension plans to defined-contribution 401(k)-type plans, Baby Boomers are the first generation who have had to save substantially for their own retirements. However, most Boomers have inadequate retirement savings; as of 2022, they had a median household retirement account balance of $289,000.[15]
Young Professionals
In 2023, there were almost 20.7 million people between the ages of 16 and 34 in professional occupations, representing 29.4 percent of the professional workforce. That same year, people in this age group represented 34.9 percent of the workforce as a whole.[16] Young professionals were overrepresented by more than three percentage points in life, physical and social science occupations (a BLS-designated professional occupation group), as well as non-professional occupation groups, including healthcare support occupations; food preparation and serving occupations; personal care and service occupations; sales occupations; and transportation and material moving occupations. They were underrepresented by more than three percentage points in management occupations; business and financial operations occupations; community and social service occupations; legal occupations; and educational, training, and library occupations, all of which are BLS-designated professional occupation groups. Considering that many professional occupations require advanced degrees that take time to complete, it is not surprising that young workers have been underrepresented in several professional occupation groups. The one non-professional occupation group where young people were underrepresented in 2023 was in building and grounds cleaning and maintenance occupations.[17]
For many young professionals, entry into the professional workforce requires a post-secondary degree, leading a growing number of young people to seek out higher education. In the 2022-2023 academic year, institutions of higher education conferred over 1.0 million associate’s degrees, over 2.1 million bachelor’s degrees, 881,000 master’s degrees, and 202,000 doctorate degrees.[18] By comparison, in 2013, 33.6 percent of 25-29 year-olds had a bachelor’s degree or higher, and by 2023, this number had risen to 40.5 percent.[19] While more education can translate into higher lifetime earnings, it also results in higher levels of student loan debt, especially when considering the rapidly rising cost of education. In the second quarter of 2024, total outstanding student loan balances rose to $1.744 trillion,[20] 93 percent of which was federal student debt.[21] While it is often associated with young graduates, student loan debt is not limited to young people. In the second quarter of 2024, 9.1 million Americans 50 and older owed a combined $400.3 billion in federal student loans, representing 23 percent of all outstanding federal student debt.[22]
The high concentration of 18-34 year olds with associate’s and bachelor’s degrees outside of the BLS-designated professional occupation groups is a sign of a labor market problem that has persisted for at least the last 30 years. This problem of underemployment can be hard to measure, though one calculation found that 32.9 percent of college graduates were underemployed as of June 2024, and that recent graduates were even more likely to experience underemployment (40.5 percent).[23]
Union Density
Union density varies widely depending on the particular occupation group. In 2023, there were 14.42 million union members in the United States, representing 10 percent of the workforce.[24] There were 6.44 million union members working in BLS-designated professional occupations (10.3 percent density),[25] and 17.1 million union professionals across all occupations (11.1 percent density).[26] While union density in professional occupations has gradually decreased over time, the overall number of union members in professional occupations has increased by more than 1 million over the last 20 years, and professionals now make up 44.6 percent of all union members, a 27.4 percent increase in share over 20 years.[27]
|
Occupational Group |
Professionals’ Union Density [1] |
|
Management occupations |
4.0% |
|
Business and financial operations occupations |
3.8% |
|
Computer and mathematical science occupations |
3.4% |
|
Architecture and engineering occupations |
4.6% |
|
Life, physical, and social science occupations |
10.5% |
|
Community and social service occupations |
15.8% |
|
Legal occupations |
5.0% |
|
Education, training, and library occupations |
36.3% |
|
Arts, design, entertainment, sports, and media occupations |
8.2% |
|
Healthcare practitioner and technical occupations |
11.9% |
|
Healthcare support occupations |
9.4% |
|
Protective service occupations |
39.4% |
|
Food preparation and serving related occupations |
4.0% |
|
Building and grounds cleaning and maintenance occupations |
11.2% |
|
Personal care and service occupations |
5.2% |
|
Sales and related occupations |
2.3% |
|
Office and administrative support occupations |
9.3% |
|
Farming, fishing, and forestry occupations |
6.6% |
|
Construction and extraction occupations |
18.4% |
|
Installation, maintenance, and repair occupations |
16.4% |
|
Production occupations |
11.2% |
|
Transportation and material moving occupations |
20.3% |
Wages and Benefits
Over 82 percent of people working in professional occupations were employed full-time in 2023.[29] As of the second quarter of 2024, the median weekly salary for full-time workers in management, professional, and related occupations was $1,579,[30] while the median for the entire full-time workforce was $1,143.[31] Professionals working in non-professional occupation groups earned less than those in professional occupations, averaging $1,196 per week.[32]
Professionals’ weekly earnings vary greatly among education levels and occupational classifications. For example, in 2023, professionals employed as surgeons, physicians, lawyers, and engineers had some of the highest median weekly earnings among those working in professional occupations, while professionals working as technicians, and in healthcare support and community and social services had some of the lowest median weekly earnings.[33] Professionals working in farming, fishing and forestry occupations have had the lowest median weekly earnings of any occupational group. As of the second quarter of 2024, their weekly salary averaged about $788, about 34 percent less than the average weekly salary of professionals working in non-professional occupation groups.[34]
Educational attainment pays off for professionals in all occupations. Workers with an associate’s degree or higher earn more than those with less educational attainment. In 2023, associates’ degree-holders earned a median weekly income of $1,058; bachelor’s degree-holders earned $1,493; master’s degree-holders earned $1,737; professional degree-holders earned $2,206; and doctorate degree-holders earned $2,109.[35] Workers with a high school diploma or some college (but no degree) earned a median weekly income of about $946.[36]
Pay Disparities
While progress has been made on some fronts, pay disparities continue to persist for women and people of color, especially in professional occupations. In 2023, women earned about $0.84 for every dollar earned by men; however, women in professional occupations only made about $0.76 for every dollar made by their male counterparts.[37] The professional occupational group with the largest wage gap was the legal occupations group, where women only earned $0.67 for every dollar earned by men. The occupation group with the smallest pay gap – only a $0.01 difference in gendered pay – was the community and social services group.[38]
Significant pay disparities have long existed for professionals who identify as Black or African American (82 percent of the earnings of white professionals in 2022), as well as Hispanic or Latino professionals (87 percent of the earnings of white professionals in 2022, though this ethnicity includes people who may identify as white). The occupation groups with the greatest disparities in pay experienced by Black or African American professionals were legal occupations and sales occupations (76 percent each of the earnings of white professionals in 2022). Professionals identifying as Hispanic or Latino faced the greatest pay disparity in legal occupations, making $0.66 for every dollar earned by white professionals in that occupation group.[39]
Health Insurance and Retirement Benefits
In March 2023, 81.6 percent of professionals were offered health insurance through their employer, with union members having a higher rate of coverage than nonmembers (94 percent versus 81 percent).[40]
Additionally, professional union members are much more likely to be covered by an employer or union sponsored retirement plan. In March 2023, 70 percent of union professionals were eligible for an employer or union sponsored retirement plan, while only 44 percent of non-union professionals were eligible for any kind of workplace retirement plan.[41]
[1] “Table 11. Employed persons by detailed occupation, sex, race, and Hispanic or Latino ethnicity.” (January 26, 2024). U.S. Bureau of Labor Force Statistics. Retrieved from https://www.bls.gov/cps/cpsaat11.htm.
[2] U.S. Census Bureau. Current Population Survey Microdata. 2023. Retrieved from https://data.census.gov/mdat.
[3] “Table 11. Employed persons by detailed occupation, sex, race, and Hispanic or Latino ethnicity.” (January 26, 2024). U.S. Bureau of Labor Force Statistics.
[4] Ibid.
[5] Role, Kemi and Shayla Thompson. (April 2024). “Purpose and Resistance: Black Women Workers Confronting Occupational Segregation.” National Employment Law Project. Retrieved from https://www.nelp.org/insights-research/occupational-segregation-of-black-women-workers-in-the-u-s/.
[6] “Table 11. Employed persons by detailed occupation, sex, race, and Hispanic or Latino ethnicity.” (January 26, 2024). U.S. Bureau of Labor Force Statistics.
[7] Ibid.
[8] U.S. Census Bureau. Current Population Survey Microdata. 2023.
[9] Adwar, Corey. “How to become a lawyer without a law degree.” (August 2 2014). Slate. Retrieved from https://slate.com/business/2014/08/states-that-allow-bar-exams-without-law-degrees-require-apprenticeships-instead-of-law-school.html.
[10] “Table 3. Employment status of the civilian noninstitutional population by age, sex, and race.” (January 26, 2024). U.S. Bureau of Labor Statistics. Retrieved from https://www.bls.gov/cps/cpsaat03.htm.
[11] “Table 11b. Employed persons by detailed occupation and age.” (January 26, 2024). U.S. Bureau of Labor Statistics. Retrieved from https://www.bls.gov/cps/cpsaat11b.htm.
[12] Doonan, Dan. “Pensions are a Vital Workforce Tool for Retaining Public Safety Professionals.” (June 27, 2024). Forbes. Retrieved from https://www.forbes.com/sites/dandoonan/2024/06/27/pensions-are-a-vital-workforce-tool-for-retaining-public-safety-professionals/.
[13] Newport, Frank. “Snapshot: Average American Predicts Retirement Age of 66.” (May 10, 2018.) Gallup. https://news.gallup.com/poll/234302/snapshot-americans-project-average-retirement-age.aspx.
[14] Fry, Richard. “The pace of Boomer retirements has accelerated in the past year.” (November 9, 2020.) Pew Research Center. Retrieved from https://www.pewresearch.org/fact-tank/2020/11/09/the-pace-of-boomer-retirements-has-accelerated-in-the-past-year/.
[15] Collinson, Catherine and Heidi Cho. “Post-Pandemic Realities: The Retirement Outlook of the Multigenerational Workforce.” (July 2023). 23rd Annual Transamerica Retirement Survey of Workers. Transamerica Center for Retirement Studies. Retrieved from https://www.transamericainstitute.org/docs/default-source/research/post-pandemic-retirement-realities-multigenerational-workforce-report-july-2023.pdf.
[16] “Table 11b. Employed persons by detailed occupation and age.” (January 26, 2024). U.S. Bureau of Labor Statistics.
[17] Ibid.
[18] “Table 318.10. Degrees conferred by postsecondary institutions, by level of degree and sex of student: Selected years, 1869-70 through 2031-32.” National Center for Education Statistics. Retrieved from https://nces.ed.gov/programs/digest/d23/tables/dt23_318.10.asp.
[19] “Table 104.20. Percentage of persons 25 to 29 years old with selected levels of educational attainment, by race/ethnicity and sex: Selected years, 1920 through 2023.” National Center for Education Statistics. Retrieved from https://nces.ed.gov/programs/digest/d23/tables/dt23_104.20.asp.
[20] Board of Governors of the Federal Reserve System. “Consumer Credit Outstanding (Levels)- G.19.” (August 7, 2024). Board of Governors of the Federal Reserve System. Retrieved from September 8, 2021. https://www.federalreserve.gov/releases/g19/current/default.htm.
[21] Federal Student Loan Portfolio. U.S. Department of Education. Retrieved from https://studentaid.gov/data-center/student/portfolio.
[22] Ibid.
[23] “Underemployment Rates for Recent College Graduates.” (July 18, 2024). Federal Reserve Bank of New York. Retrieved from https://www.newyorkfed.org/research/college-labor-market#--:explore:unemployment.
[24] “Table 42. Union affiliation of employed wage and salary workers by occupation and industry.” (2023). U.S. Bureau of Labor Statistics. Retrieved from https://www.bls.gov/cps/cpsaat42.htm.
[25] Ibid.
[26] U.S. Census Bureau. Current Population Survey Microdata. 2023.
[27] Ibid.
[28] Ibid.
[29] “Table 23. Persons at work by occupation, sex, and usual full- or part-time status.” (January 24, 2024). U.S. Bureau of Labor Statistics. https://www.bls.gov/cps/cpsaat23.htm.
[30] “Table 4. Median usual weekly earnings of full-time wage and salary workers by occupation and sex, quarterly averages, not seasonally adjusted.” (July 17, 2024). U.S. Bureau of Labor Statistics. Retrieved from https://www.bls.gov/news.release/wkyeng.t04.htm.
[31] “Table 3. Median usual weekly earnings of full-time wage and salary workers by age, race, Hispanic or Latino ethnicity, and sex, 2nd quarter 2024 averages, not seasonally adjusted.” (July 17, 2024). U.S. Bureau of Labor Statistics. Retrieved from https://www.bls.gov/news.release/wkyeng.t03.htm.
[32] U.S. Census Bureau. Current Population Survey Microdata. 2023.
[33] “Table 39. Median weekly earnings of full-time wage and salary workers by detailed occupation and sex.” (January 26, 2024). U.S. Bureau of Labor Statistics. Retrieved from https://www.bls.gov/cps/cpsaat39.htm.
[34] U.S. Census Bureau. Current Population Survey Microdata. 2023.
[35] “Education Pays, 2023.” (April 2024). Career Outlook, U.S. Bureau of Labor Statistics. Retrieved from https://www.bls.gov/careeroutlook/2024/data-on-display/education-pays.htm.
[36] Ibid.
[37] “Table 39: Median weekly earnings of full-time wage and salary workers by detailed occupation and sex.” (January 26, 2024). U.S. Bureau of Labor Statistics. Retrieved from https://www.bls.gov/cps/cpsaat39.htm.
[38] Ibid.
[39] “Table 18. Median usual weekly earnings of full-time wage and salary workers by occupation, sex, race, and Hispanic or Latino ethnicity, 2022 annual averages.” (November 2023). Labor Force Characteristics by Race and Ethnicity, 2022. U.S. Bureau of Labor Statistics. Retrieved from https://www.bls.gov/opub/reports/race-and-ethnicity/2022/home.htm.
[40] Current Population Survey, Annual Social and Economic Supplement. U.S. Census Bureau. March 2023. Retrieved from https://data.census.gov/mdat.
[41] Ibid.
Library Professionals: Facts & Figures
2024 Fact Sheet
Highlights:
Between 2022 and 2023, employment among librarians, library technicians, and library assistants declined, with librarian employment decreasing at the greatest rate (10.8 percent) during this period.
In 2023, librarians who were union members earned 27 percent more per week than their non-union counterparts. Union library professionals are more likely than their non-union counterparts to be covered by a retirement plan, health insurance, and paid sick leave.
The librarian profession suffers from a persistent lack of racial and ethnic diversity that has not changed significantly over the past 15 years. Librarians and other library professionals also tend to be slightly older than the general workforce.
Library Professionals Employment, 2005-2023
Librarians and other library professionals provide essential services for schools, universities, and communities. Americans go to libraries for free, reliable, and well-organized access to books, the Internet, and other sources of information and entertainment; assistance finding work; research and reference assistance; and programs for children, immigrants, seniors and other groups with specific needs, just to name a few.
This fact sheet explores the role of library staff in the workforce, the demographics, educational attainment and wages of librarians, as well as the benefits of union membership for librarians and other issues faced by library staff.
Library Occupations and Library Usage: By the Numbers
Library Employment
In 2023, there were approximately 146,500 librarians, 32,400 library technicians, and 73,400 library assistants employed in public libraries, primary and secondary schools, institutions of higher education, museums and archives, as well as in libraries operated by private corporations, government agencies, religious groups and other organizations.
Employment of professionals has been gradually declining after hitting a peak of 394,900 in 2006.[1]
Of the three occupation groups, librarian employment decreased at the greatest rate (10.8 percent) between 2022 and 2023.
Library Programs
In 2022, more than 17,500 U.S. public libraries circulated about 2.2 billion print and electronic materials and offered 3.3 million programs, attended by about 64 million members of the public. Children’s programs accounted for 49 percent of all programs offered, serving over 35 million children and parents.[2]
Electronic media, computer use and internet access are an increasing component of library materials and services, and e-books now comprise 57 percent of all collection materials. In addition, library patrons accessed over 273,000 public computers over 83 million times during 2022.[3]
Libraries provide important training and educational programs for the public. A 2020 survey by the Public Library Association revealed that more than 88 percent of public libraries offer at least basic digital literacy training, and in many cases more advanced technology training.[4] Additionally, a 2022 survey also by the Public Library Association revealed that 78 percent of public libraries provide job and career services; 24 percent have workforce development programs; and 51 percent offer assistance with health insurance enrollment.[5]
In a 2016 Pew Research survey, 77 percent of Americans aged 16 and older believed libraries provided necessary resources. Among young people (aged 16 to 29), 84 percent believed libraries provided them with necessary resources.[6]
In 2016, 46 percent of adults said they used a public library or bookmobile in the previous 12 months. Millennials (born 1981-1996) had the highest usage rate of any generation over the age of 18 at the time of the study, at 53 percent.[7]
Duties and Roles of Library Professionals
While specific roles and responsibilities may change depending on the size and setting of libraries, librarians and other library professionals’ main role is to help people find information and conduct research on a variety of personal, professional, and academic subjects. Library professionals also teach classes, organize library collections, and tailor programs to a variety of audiences, including young children, students, professionals, and the elderly.[8]
Librarians are also often responsible for multiple aspects of management, including ordering books and other materials; purchasing new technology; supervising library technicians, assistants, and volunteers; and managing library budgets.[9]
Library technicians assist librarians in the operation of libraries, and their tasks include assisting visitors, organizing library materials, and performing administrative and clerical functions. Library assistants have similar roles as library technicians, but may have fewer independent responsibilities. [10]
Where Library Professionals Work
Librarian employment in 2023 was split between public libraries (38 percent); elementary and secondary schools (27 percent); colleges, universities, and professional schools (24 percent); and other libraries and archives, including those at businesses, law firms, nonprofit organizations, and scientific organizations (11 percent).[11]
Employment of library technicians in 2023 was split between public libraries (46 percent); elementary and secondary schools (12 percent); colleges, universities, and professional schools (11 percent); and other libraries and archives, including those at businesses, nonprofit organizations, and scientific organizations (31 percent).
Employment of library assistants in 2023 was split between public libraries (39 percent); colleges, universities, and professional schools (20 percent); elementary and secondary schools (16 percent); and other libraries and archives, including those at businesses, nonprofit organizations, and public administration agencies (25 percent).[12]
In 2023, 25 percent of librarians, 53 percent of library technicians, and 56 percent of library assistants worked part-time.[13]
Diversity and Demographics of Library Professionals
The librarian profession suffers from a persistent lack of racial and ethnic diversity that has not changed significantly over the past 15 years.[14]
Just over 81 percent of librarians identified as white in 2023. Library technicians and assistants were slightly more diverse. Among library assistants, 73 percent identified as white in 2023.[15]
In 2023, seven percent of librarians identified as Black or African American and 11 percent identified as Hispanic or Latino of any race. Additionally, librarians identifying as Asian American or Pacific Islander made up 5.5 percent.[16]
Librarians are slightly less diverse than the workforce of professionals in all education, training, and library occupations, which is 80 percent white. Black and African American professionals make up 11 percent of the total education, training, and library workforce, while Hispanic and Asian professionals represented 12 percent and six percent, respectively.[17]
Librarians and other library professionals are only slightly older than the general workforce. While Americans over 55 accounted for 23 percent of the total workforce in 2023, 26 percent of librarians were over the age of 55.[18]
Educational Attainment
In many settings, librarians are required to hold at least a master’s degree in library science or meet state teaching license standards for being a school librarian.[19] Many other library workers, including lower-paid library technicians and library assistants have high educational attainment as well.
In 2023, 63.6 percent of librarians held a master’s degree or higher, 17.0 percent held a bachelor’s degree, and 4.5 percent held an associate’s degree.[20]
In comparison, in 2023, 6.9 percent of library technicians held a master’s degree or higher, 23.8 percent held a bachelor’s degree, 12.8 percent held an associate’s degree, and 47.6 percent had a high school diploma or equivalent as their highest degree attained.
In 2023, 9.8 percent of library assistants held a master’s degree or higher, 37.3 percent held a bachelor’s degree, 11.1 percent held an associate’s degree, and 9.6 percent had a high school diploma or equivalent as their highest degree attained.[21]
Women and Library Professions
In 2023, women accounted for 82.5 percent of all librarians, and 83.2 percent of library assistants, which was above the average of 72.8 percent for women employed in all education and library professions.[22] The library professions have predominantly employed women for years. In comparison, in 1995, women were 83.9 percent of librarians, and in 2003, women were 84.4 percent of librarians.[23]
Women represented 82.5 percent of graduates in Master of Library Science (MLS) programs in 2021-2022. However, Black women and Asian or Pacific Islander women only accounted for 4.6 percent and 2.7 percent of all MLS graduates, respectively. Hispanic women made up 8.4 percent of the 2022 class.[24]
Library Worker Earnings and the Wage Gap
In 2023, the mean hourly wage for librarians working full-time was $32.97 and the mean annual salary was $68,570. The mean hourly wage was $20.46 for library technicians and $17.29 for library assistants.[25]
Regional Variance in Salaries
Librarian earnings vary significantly from region to region. The District of Columbia had the highest mean annual earnings for full-time librarians at $93,640 in 2023, followed by Washington, California, Maryland, and New York. These salaries were not adjusted for differences in cost of living across states.
Institutional Variance in Compensation
Library staff compensation also varied based on the type of library employer. On average, librarians working full-time at colleges, universities, and professional schools earned $73,890 in 2023, elementary and secondary school librarians earned $71,800 and librarians employed by local governments (excluding education) made $62,360.[26]
Gender Inequality
Pay inequity remains a persistent and pervasive problem in society. In 2023, median weekly earnings for women in all occupations were 83.6 percent of men’s earnings.[27] For most women of color, the earnings gap is even larger: Black or African American women earned just 74 cents for every dollar earned by men of all races in 2023 and Hispanic and Latina women earned just 66.6 cents on the dollar.[28] Asian women were the only racial group to earn more than men of all races, but they still earned only 79.4 cents to the dollar reported by Asian men.[29]
Though library occupations are predominantly held by women, a wage gap still exists in the profession. In 2022, women working as full-time library assistants (35 hours or more per week) reported median annual earnings that were only 82.3 percent of the median annual earnings reported by men.[30] Between 2021 and 2022, the wage gap for librarians has narrowed considerably, from 88 percent of the median annual earnings reported by men in 2021 to 97.7 percent in 2022.[31]
The American Library Association-Allied Professional Association published the 6th edition of their Advocating for Better Salaries Toolkit in April 2017. The toolkit includes sections on how to determine fair compensation for librarians, advocating for raises, identifying pay inequities and salary negotiation tips. Importantly, the toolkit identifies union organizing and collective bargaining as an effective means to increase librarian pay and increase equity in the workplace.[32]
Health Benefits
In 2022, 72.2 percent of librarians had health insurance through a current or former employer or union, and librarians working 35 hours per week or more had a much higher coverage rate of 91.3 percent. In 2022, 3.2 percent of librarians were uninsured.[33]
Among library technicians in 2022, just 68 percent received health insurance through a current or former employer or union. Though 85 percent of library technicians working full-time received health insurance through their employer or union, a total of 3.6 percent of library technicians were uninsured in 2022.[34]
Among library assistants in 2022, 63.3 percent had employer-provided health insurance, though the rate was higher for full-time library assistants at 82.7 percent, leaving 4.5 percent of library assistants uninsured in 2022.[35]
The Union Difference
Unions are an important way for library professionals to negotiate collectively for better pay, benefits, and working conditions. Unions work to elevate library professions and secure working conditions that make it possible to provide professional service.
In 2023, professionals working in education, training, and library occupations had the highest unionization rate for any professional occupation group, 36.5 percent.[36]
In 2023, 27 percent of librarians were union members.[37]
Wages and Benefits
Union librarians and library workers have leveraged their collective voices to earn fair wages and stronger benefits. Wages and benefits earned by union librarians and library workers are more commensurate with the skilled and professional nature of library work.
In 2023, librarians who were union members earned 27 percent more per week than their non-union counterparts and union library assistants earned 42 percent more per week than their non-union counterparts.[38] While these statistics are subject to volatility due to small sample sizes, trends in the data show that it pays to be a union library professional.
Union members are more likely than their non-union counterparts to be covered by a retirement plan, health insurance, and paid sick leave. In 2023, 95 percent of union members in the civilian workforce had access to a retirement plan, compared with only 70 percent of non-union workers. Similarly, 95 percent of union members had access to employer provided health insurance, compared to 71 percent of non-union workers. Additionally, 92 percent of union members in the civilian workforce had access to paid sick leave compared to 78 percent of non-union workers.[39]
Union Library Professionals Success Stories
In many states, collective bargaining rights of public sector employees, including professionals at public libraries, are established by state and municipal laws rather than at the federal level. This creates additional barriers for public sector workers to join together in union. While some states have anti-union laws in place that restrict the extent to which public sector employees can collectively bargain, that trend has been changing over the last few years, as some states have passed pro-worker legislation. Featured below are some legislative and organizing highlights from union library professionals over the past few years.
In late April 2024, library professionals in the state of Maryland won collective bargaining rights when the state’s Library Workers Empowerment Act was signed into law. Before this law existed, the right of library professionals to collectively bargain in this state was determined on a county-by-county basis. Library professionals across Maryland will now be able to collectively negotiate with their employers for better pay and benefits and improved working conditions through union representation. Additionally, in 2022, after fighting for years for their right to collectively bargain in Baltimore County, Maryland, public library employees voted to unionize and join the International Association of Machinists and Aerospace Workers (IAMAW).[40] IAMAW worked with Maryland public library employees to help advocate for the collective bargaining rights of library workers and the passage of the 2024 Library Workers Empowerment Act.
Advocacy for public sector collective bargaining has also been gaining momentum in the state of Virginia over the past few years, as a growing number of counties and municipalities have been passing laws granting collective bargaining rights to more public sector employees, including public library workers.[41] This activity is due to a state law that went into effect in May 2021 allowing counties, municipalities, and towns to recognize labor unions as bargaining representatives for public employees. A major victory for Virginia’s public sector professionals in education and library services took place in June 2024, when over 27,000 public sector school employees, including school librarians, in Virginia’s Fairfax County voted overwhelmingly to join in union and be represented jointly by the American Federation of Teachers (AFT) and the National Education Association.[42]
Additionally, in March 2023, the state of Michigan repealed its anti-union right-to-work law, which allowed employees in unionized workplaces to opt out of paying dues while still reaping the benefits of union representation. When the law went into effect in February 2024, Michigan’s union library professionals – and unionized employees more broadly – became part of stronger unions that are now better able to support the needs of their members.
Gains made by union library professionals in their first contracts
Library professionals have seen organizing victories and contract gains across the U.S. Unions including AFT, IAMAW, Office and Professional Employees International Union (OPEIU), and the United Steelworkers (USW) represent a growing number of library professionals in both public and private sector libraries. Many union library professionals who have recently ratified their first contracts have seen significant gains, including increases in pay and starting salaries, guaranteed annual wage increases, and job protections.
In January 2024, library professionals and library workers represented by the Ohio Federation of Teachers (part of AFT) at the Grandview Heights Public Library in Grandview Heights, Ohio ratified their first contract. They won new benefits of paid parental leave and partial tuition reimbursement, as well as 12 percent raises over the course of the contract.[43]
In June 2023, college staff, including library professionals, represented by OPEIU at the Cornish College of the Arts in Seattle, Washington ratified their first contract, which included a retroactive base wage increase of four percent to the previous year and an additional three percent wage increase in the first year of the contract. They also secured protective measures against layoffs in the event of the introduction of new technology that could impact staffing, and the agreement established a Labor Management Committee to promote improved working conditions.[44]
In July 2022, librarians, archivists, and curators across all three University of Michigan campuses ratified their first contract after voting the previous year to join in union with AFT Local 6244, the Lecturers’ Employee Organization. Among other substantial gains, the librarians, archivists, and curators on the lowest end of the pay scale received raises between nine and 30 percent. Additionally, collective bargaining granted academic freedom to these library professionals, a right previously afforded only to university faculty.[45]
In January 2022, library professionals represented by USW at the Carnegie Library of Pittsburgh ratified their first contract, which included “standardizing positions into ‘Job Grades’ and increasing starting wages, most significantly among the lowest-paid positions; wage increases for current workers guaranteed by four raises over the life of the four-year agreement; limitations to health insurance rate hikes, and the addition of Christmas Eve and Juneteenth as paid holidays.”[46]
[1] U.S. Census Bureau. Current Population Survey Microdata. 2023. Available at https://data.census.gov/mdat
[2] The Institute of Museum and Library Services. (2024). Public Libraries in the United States: Fiscal year 2022. Available at https://www.imls.gov/research-evaluation/data-collection/public-libraries-survey/explore-pls-data/pls-data
[3] Ibid.
[4] Public Library Association. (2021). 2020 Public Library Technology Survey Summary Report. Available at https://alair.ala.org/items/011dcef4-7a0f-4570-b351-a50372496217
[5] Public Library Association. (2023). Public Library Services for Strong Communities Report: Results from the
2022 PLA Annual Survey. Available at https://www.ala.org/sites/default/files/pla/content/data/PLA_Services_Survey_Report_2023.pdf
[6] Horrigan, John B. “Libraries 2016.” Pew Research Center. September 9, 2016. Available at https://www.pewresearch.org/internet/wp-content/uploads/sites/9/2016/09/PI_2016.09.09_Libraries-2016_FINAL.pdf
[7] Geiger, Abigail. “Millennials are the most likely generation of Americans to use public libraries.” FactTank. Pew Research Center. June 21, 2017. Available at https://www.pewresearch.org/fact-tank/2017/06/21/millennials-are-the-most-likely-generation-of-americans-to-use-public-libraries/. Note that members of Gen Z (born 1997-2012) were not part of this study.
[8] U.S. Department of Labor, Bureau of Labor Statistics, Occupational Outlook Handbook, “Librarians.” 2023. Available at: https://www.bls.gov/ooh/education-training-and-library/librarians.htm
[9] Ibid.
[10] U.S. Department of Labor, Bureau of Labor Statistics, “Occupational Outlook Handbook, Library Technicians and Assistants.” 2023. https://www.bls.gov/ooh/education-training-and-library/library-technicians-and-assistants.htm
[11] U.S. Census Bureau. Current Population Survey Microdata. 2023. Available at https://data.census.gov/mdat
For the purposes of this factsheet, all private sector libraries and archives are included in the “other private and nonprofit libraries” classification, though some private, not-for-profit libraries (such as the Carnegie system of libraries in Pittsburgh) play the role of public libraries in their communities.
[12] Ibid.
[13] Ibid.
[14] In comparison, librarians were 85.3 percent white in 2015, 84 percent white in 2010 and 88.3 percent white in 2005. Source: U.S. Census Bureau. American Community Survey Microdata. 2005-2015. Available at https://data.census.gov/mdat
[15] U.S. Department of Labor, Bureau of Labor Statistics. Table 11: Employed persons by detailed occupation, sex, race, and Hispanic or Latino ethnicity, Annual Averages, 2023. Available at https://www.bls.gov/cps/cpsaat11.pdf
[16] Ibid.
[17] Ibid.
[18] U.S. Department of Labor, Bureau of Labor Statistics. Table 11b: Employed persons by detailed occupation and age, 2023. Available at https://www.bls.gov/cps/cpsaat11b.htm
[19] U.S. Department of Labor, Bureau of Labor Statistics, Occupational Outlook Handbook, “Librarians.” 2023.
[20] U.S. Census Bureau. Current Population Survey Microdata. 2023. Available at https://data.census.gov/mdat
[21] Ibid.
[22] U.S. Department of Labor, Bureau of Labor Statistics. Table 11: Employed persons by detailed occupation, sex, race, and Hispanic or Latino ethnicity, Annual Averages, 2023. Available at https://www.bls.gov/cps/cpsaat11.pdf
[23] U.S. Department of Labor, Bureau of Labor Statistics, Current Population Survey, Annual Averages, 1995, and 2003, Table 11, op. cit.
[24] U.S. Department of Education, National Center for Education Statistics, Digest of Education Statistics. Tables 323.30 and 323.50. 2021-2022. Available at https://https://nces.ed.gov/programs/digest/2023menu_tables.asp
[25] Occupational Employment Statistics. Bureau of Labor Statistics. May 2023. Available at https://www.bls.gov/oes/current/oes_stru.htm
[26] Ibid.
[27] U.S. Department of Labor, Bureau of Labor Statistics, Current Population Survey, Table 37, “Median weekly earnings of full-time wage and salary workers by selected characteristics.” 2023. Available at http://www.bls.gov/cps/cpsaat37.pdf
[28] Ibid.
[29] Ibid.
[30] U.S. Census Bureau. Full-Time, Year-Round Workers & Median Earnings by Sex & Occupation. American Community Survey. 2022. Available at https://www.census.gov/data/tables/time-series/demo/industry-occupation/median-earnings.html
[31] Ibid.
[32] Bartholomew, Amy, Jennifer Dorning, Julia Eisenstein, & Shannon Farrell. “Advocating for Better Salaries Toolkit.” ALA Allied Professional Association. April 2017. Available at https://alair.ala.org/items/4c36b254-8692-41e7-bcb2-d570b4cc4498
[33] U.S. Census Bureau, American Community Survey, Public Use Microdata, 2022. Available at https://data.census.gov/mdat/
[34] Ibid.
[35] Ibid.
[36] U.S. Department of Labor, Bureau of Labor Statistics, “Table 42. Union affiliation of employed wage and salary workers by occupation and industry.” 2023. Available at https://www.bls.gov/cps/cpsaat42.htm
[37] Hirsch, Barry and Macpherson, David. Union Membership, Coverage, Density, and Employment by Occupation, 2023. Union Membership and Coverage Database from the CPS. Available at http://unionstats.com/
[38] U.S. Census Bureau. Current Population Survey Microdata. 2023. Available at https://data.census.gov/mdat.
[39] U.S. Department of Labor, Bureau of Labor Statistics. National Compensation Survey: Employee Benefits in the United States, March 2023. Available at https://www.bls.gov/news.release/pdf/ebs2.pdf
[40] DeVille, Taylor. “Baltimore County Library Staff Votes to Form Union.” Baltimore Sun. January 7, 2022. Available at https://www.baltimoresun.com/maryland/baltimore-county/bs-md-co-county-library-staff-unionize-20220107-unnyd7xavvbsrcj3amgwda7fry-story.html
[41] Overman, Stephenie. “In Virginia, ‘Patchwork’ of Ordinances Makes Public-Sector Organizing a Maze.” Virginia Mercury. January 16, 2023. Available at https://virginiamercury.com/2023/01/16/in-virginia-patchwork-of-ordinances-makes-public-sector-organizing-a-maze/
[42] “More than 27,500 Fairfax County (Va.) Education Workers Overwhelmingly Win Historic Union Elections.” American Federation of Teachers. June 10, 2024. Available at https://www.aft.org/press-release/more-27500-fairfax-county-va-education-workers-overwhelmingly-win-historic-union
[43] “First Union Contract Goes Into Effect for Grandview Heights Public Library Workers.” Ohio Federation of Teachers, AFT. January 2, 2024. Available at https://www.oft-aft.org/press/first-union-contract-goes-effect-grandview-heights-public-library-workers
[44] Collective Bargaining Agreement Between the Cornish College of the Arts and Office and Professional Employees International Union Local no. 8, AFL-CIO, For the period of July 25, 2023 through August 31, 2025. Available at https://www.cornish.edu/wp-content/uploads/2023/12/Cornish-CBA-OPEIU8-_2023-2025.pdf
[45] Dodge, Samuel. “17% Salary Increase Part of First-ever Librarian Union Deal with University of Michigan.” Michigan Live. July 29, 2022. Available at https://www.mlive.com/news/ann-arbor/2022/07/17-salary-increase-part-of-first-ever-librarian-union-deal-with-university-of-michigan.html
[46] “Carnegie Library Workers Ratify First Labor Agreement.” United Steelworkers. January 7, 2022. Available at https://m.usw.org/news/media-center/releases/2022/carnegie-library-workers-ratify-first-labor-agreement
Digital Trade: A Primer for Professionals
2022 Fact Sheet
Highlights:
Digital trade, or the buying and selling of goods and services online and the transmission of digital information across borders, affects practically all professionals’ working and personal lives.
Corporations are lobbying for international digital trade agreements that lock in pro-business, pro-employer rules that have already been negatively impacting workers.
Pro-worker digital trade rules should seek to protect professionals from the harmful effects of digital trade, including but not limited to offshoring computer-based jobs, digital workplace monitoring, digital theft of creative works, and the misappropriation of digital likenesses.
When professionals join together in union, they can have a say in not just the development of digital trade rules, but also the digital policies at their workplace.
Today, most professionals’ work and livelihoods are directly impacted by the laws and rules that govern the use of digital technologies worldwide. This fact sheet provides a primer on digital trade and how digital trade rules affect professionals’ working and personal lives. The fact sheet also highlights how, by joining together in union, professionals can have a say in both their workplaces and halls of government to ensure that digital trade improves the lives of working people, not just employers.
Increased Attention for Digital Trade

Given technology’s global reach, the international rules governing digital trade – the buying and selling of goods and services online, as well as the transmission of digital information across borders, or cross-border data flows – are particularly critical. Digital trade is garnering increased attention among policy makers,[1] moving from just one of many chapters in trade agreements[2] to a primary focus as the digital economy[3] continues to rapidly expand. For instance, digital trade features prominently in the trade pillar of the Indo-Pacific Economic Framework for Prosperity (IPEF), which the United States is currently negotiating with 12 of the 13 IPEF countries.[4]
As policymakers increasingly emphasize digital trade, it is critical that they hear from professionals because digital trade rules affect their working lives. Corporations are lobbying for international trade agreements that lock in pro-business, pro-employer rules. Experience from past trade deals demonstrates that, once adopted, these business-friendly international trade rules make it extremely difficult for countries to pass future laws that protect working people and their families from the harmful consequences of unchecked corporate greed. Ultimately, the result is that there is little ability to safeguard the transmission of data across borders or technologies involving artificial intelligence (AI) that are rapidly advancing without society yet knowing the full ramifications. When working people have input, digital trade rules can promote and strengthen the economy and at the same time protect professionals.
Digital Trade Rules Impact Professionals
Here are the issues that should inform resilient, long-lasting, pro-worker digital trade rules, and how digital trade can directly impact professionals in the workplace:

Offshoring and outsourcing
Trade-enabled offshoring and outsourcing[5] are not new business practices; however, the extent of professional jobs at risk of shifting overseas has greatly expanded. Since the COVID-19 pandemic, the risk has become even greater, as many professionals’ jobs transitioned to fully remote work.[6] Today nearly any professional whose job involves computer applications is at risk of corporations moving their job to countries with lower wages and fewer labor protections.

Digital privacy
Essentially any Internet-connected device or software can track and collect user information. In the workplace, the tracking and collecting of user information translates to digital monitoring of employees. Employer-administered digital communications and digital information management are generally the employer’s property and, in non-union workplaces, can be subject to unlimited, undisclosed monitoring. Because surveillance and monitoring are mandatory subjects of bargaining, union professionals have the right to negotiate with their employer over digital workplace surveillance.
Bossware is automated employee monitoring software that employers can use to track the activities of their employees. Employees often do not know that their bossware-enabled computer or device is tracking their activities, including their keystrokes. Bossware is now the norm in a variety of jobs, and since the start of the COVID-19 pandemic, a growing number of companies have deployed bossware to surveil employees working remotely, both on and off the clock.[7]
Bossware threatens the mental and physical wellbeing of professionals, making them feel like they are constantly falling behind due to oppressive performance metrics. Monitoring software can also lead to discrimination against people with disabilities who may work at a different pace or require alternative working conditions than their differently-abled coworkers.[8]
Digital trade rules can determine if countries are able to address the unconstrained nature of cross-border digital workplace monitoring. For instance, a trade agreement could make future technological governance difficult if passing domestic legal safeguards means that the U.S. is out of compliance with the trade agreement and subject to penalties. Resilient digital trade rules must provide public policy space for U.S. professionals to protect their interests now and as novel issues arise in the future.
In addition, employee wellness programs, wearable technology, and self-tracking devices can collect personal biometric and medical information about employees. With this “datafication” of employee health, personal data can end up in the hands of a third party[9] and be used to develop other algorithms without the employee’s knowledge. It is often unclear who owns the digital information generated by the devices or apps – the employee, the employer, or the company that created the technology[10] – a legal uncertainty that generally leaves employees without options for recourse.

Cybersecurity
An employer’s approach to data storage can pose security risks, as many employers contract data localization services to third parties, some of whom are overseas in countries that lack rigorous data privacy and security standards. Robust cybersecurity and digital trade policies represent two sides of the same coin; they can simultaneously strengthen international cooperation and promote secure and resilient information systems.

The co-opting of creative control
Computer-automated and artificially intelligent systems can control work processes without any human input or intervention. For-profit companies based around the world have developed AI-driven software that can generate not only legible content, but also content that is complex, creative, and deceptively naturalistic. AI software is even finding its way into the classroom. This software can “write” K-12 lesson plans, replacing the teachers’ creative control over their classrooms, as well as their hard-earned skills and expertise.[11] Digital trade rules will influence how AI software for creative control is deployed in workplaces. In the case of education, these rules will influence how much creative control teachers have in their lesson plans, where the digital data collected from K-12 students is stored, who has access to that data and how it gets used, and other important factors that affect the lives of students and education professionals. When union professionals are part of trade policy discussions, they can help shape the future of work.

Copyright, digital theft, and misappropriation
Creative works can now be stolen and transmitted illegally at rapid speeds and in ever increasing quantities. Stolen or otherwise illegitimate content undermines the value of creative professionals’ work, threatens their hard-won pay and benefits, and puts future job opportunities at risk.[12] In today’s digital era, creative professionals need strong copyright protections to earn a fair return on their work and ensure continued job opportunities. U.S. trade agreements should not include outdated, overbroad safe harbor provisions modeled on Section 512 of the Digital Millennium Copyright Act. Due to a series of harmful court decisions, Section 512, which was originally intended to create a narrow protection to a nascent industry, now acts as a nearly free pass for platforms to profit from stolen or otherwise illegitimate content posted by third parties. When U.S. trade agreements include an online safe harbor rule similar to Section 512, they allow stolen or otherwise illegitimate content to proliferate across the globe.
Along with content theft, union creative professionals too often experience their voices, images, and likenesses misappropriated for use in unauthorized AI-generated online content. The reality is that AI is advancing more rapidly than society can fully evaluate the technology’s impact. What is already clear are the dangers and downsides, including image-based sexual abuse, misappropriation for commercial gain, and the proliferation of disinformation using known public figures without their consent. The U.S. should therefore not include in trade agreements a provision modeled on Section 230 of the Communications Decency Act, which allows online platforms to avoid responsibility for unlawful user content they themselves facilitated or profit from. Inclusion of Section 230-type language in U.S. trade agreements is a mistake that makes it difficult to establish safeguards against content that puts ordinary people, including DPE unions’ members, at risk.
Professionals need not feel that the dynamics of the digital economy are beyond their control. By joining together in union, professionals can have a say in the development of trade rules. For instance, through the Labor Advisory Committee for Trade Negotiations and Labor Policy, union professionals can advise the U.S. government on matters of international trade, providing input before the U.S. enters into trade agreements.[13] Even more importantly, through collective bargaining, union professionals have a say in the digital policies at their workplaces. No matter what may end up in trade agreements, the contracts that union professionals negotiate with their employers contain legally binding rules that protect employees from adverse employer actions.
Here are a few examples of how union professionals are using their collective power to secure legally binding workplace protections in the Internet age:
Preventing the offshoring of computer-based jobs
Tech professionals at Google contractor, HCL America, Inc., members of the United Steelworkers (USW), negotiated contract language that establishes a minimum number of jobs at their Pittsburgh-based location after HCL tried to offshore computer-based work to Poland.[14]
Combating intrusive digital surveillance
Kickstarter employees, members of Office and Professional Employees International Union (OPEIU) Tech Workers Union Local 1010, negotiated a contract provision that prohibits their employer from actively observing an employee’s keystrokes, keeping track of how long the employee may be away from the computer, and monitoring the employee’s activity through their computer camera or microphone.[15]
Protecting digital privacy
Members of the International Association of Machinists and Aerospace Workers (IAMAW) have developed contract language that seeks to curb an employer’s ability to use the data it collects through electronic surveillance.[16]
Putting an end to the misappropriation of digital likenesses
All contracts for Screen Actors Guild - American Federation of Television and Radio Artists (SAG-AFTRA) members working in areas involving AI include terms that protect the performer’s right to consent (or not to consent) to use of their digital likeness, among many other protections.[17]

What’s ahead for digital trade?
The digital economy is still evolving, and the development of digital trade rules will continue into the future. Professionals can ensure that they have input into the development of digital policies – both what gets negotiated into trade agreements and the rules governing individual workplaces – by joining together in union. The collective power of a union can ensure for working people that the digital economy works for everyone, not just wealthy corporations.
[1] See, e.g., “Carper, Young, Colleagues Introduce Bipartisan Resolution to Promote the U.S. Digital Economy and Digital Trade,” Press Release (July 28, 2022), https://www.carper.senate.gov/public/index.cfm/pressreleases?ID=F71C4B63-BDC4-4A3F-B56F-1963768C828C.
[2] For examples, see the US-Japan Digital Trade Agreement and the United States-Mexico-Canada Agreement (USMCA).
[3] For a definition of digital economy, see Tina Highfill and Christopher Surfield, “New and Revised Statistics of the U.S. Digital Economy, 2005–2020,” Bureau of Economic Analysis, U.S. Department of Commerce (May 2022), p. 4, https://www.bea.gov/system/files/2022-05/New%20and%20Revised%20Statistics%20of%20the%20U.S.%20Digital%20Economy%202005-2020.pdf.
[4] The Indo Pacific Economic Countries include the United States, Australia, Brunei Darussalam, Fiji, India, Indonesia, Japan, Republic of Korea, Malaysia, New Zealand, Philippines, Singapore, Thailand, and Vietnam. As of October 2022, every IPEF country but India has agreed to participate in the trade pillar.
[5] Offshoring is the shifting overseas of jobs that were once done domestically, whereas outsourcing involves contracting a specific process to a third party that specializes in that process.
[6] Andrew Van Dam, “The Remote Revolution Could Lead to Offshoring Armageddon,” The Washington Post (26 Aug 2022); and Rani Molla, “The Future of Remote Work, According to Six Experts,” Vox (July 24, 2022): https://www.vox.com/recode/23205039/future-remote-work-experts-promotion-recession.
[7] Bennett Cypher & Karen Gullo, “Inside the Invasive, Secretive ‘Bossware’ Tracking Workers,” Electronic Frontier
Foundation (June 30, 2020), https://www.eff.org/deeplinks/2020/06/inside-invasive-secretive-bossware-tracking-workers.
[8] Matt Scherer, “Warning: Bossware May be Hazardous to Your Health,” Center for Democracy and Technology,
[9] Elizabeth A. Brown, “A Healthy Mistrust: Curbing Biometric Data Misuse in the Workplace,” Stanford Technology Law Review 23.2 (2020).
[10] Skyler R. Berman, “Bargaining Over Biometrics: How Player Unions Should Protect
Athletes in the Age of Wearable Technology,” Brooklyn Law Review 85:2 (2020).
[11] For more on AI in education, see, e.g., Alex Beard, “Can Computers Ever Replace the Classroom?” The Guardian (19 March 2020): https://www.theguardian.com/technology/2020/mar/19/can-computers-ever-replace-the-classroom; Daniel Schiff, “Out of the Laboratory and into the Classroom,” AI and Society 36 (2021): pp. 331-48; and Rob Weil, “Jasmine’s Day: An AI Education Story,” New England Journal of Public Policy 34.1 (2022).
[12] “Intellectual Property Theft: A Threat to Working People and the Digital Economy” (2021.) DPE. https://www.dpeaflcio.org/factsheets/intellectual-property-theft-a-threat-to-working-people-and-the-economy
[13] LAC Charter, May 2020, https://ustr.gov/sites/default/files/files/LAC%20Charter%20052020.pdf.
[14] USW-HCL America, Inc. Collective Bargaining Agreement, 2021.
[15] OPEIU Tech Workers Union Local 1010-Kickstarter Collective Bargaining Agreement, 2022.
[16] “Protecting Worker Privacy: Electronic Surveillance Contract Language,” IAM Strategic Resources and Legal Department, https://actionnetwork.org/user_files/user_files/000/042/101/original/Protecting_Worker_Privacy_Electronic_Surveillance_Contract_Language__by_IAM_Strategic_Resources_Legal_Department.pdf
[17] “Entertainment in the Age of AI,” SAG-AFTRA 11.3 (Summer 2022): pp. 42-44.
Creative Professionals Depend on Strong Copyright Protections
2022 Data Sheet
Many union members earn collectively bargained pay and contributions to their health insurance and pension plans from the sales and licensing of content they help create. That’s why, while not typically the copyright holder, the theft and unlicensed use of copyrighted content threatens these middle class professionals’ economic security and more than five million jobs in the creative sector.

Outdated U.S. copyright law encourages the stealing of content and theft of creative professionals’ pay and benefits
Congress enacted Section 512 of the Digital Millennium Copyright Act (DMCA) in 1998 in the Internet’s infancy. Today, due to a string of ill-conceived court decisions and advancements in technology, Section 512 enables the largest companies in the world to build businesses that profit from unlicensed use of copyrighted works without compensating their owners or contributing to the pay, health care, or retirement security of creative professionals.
In today’s digital era, creative professionals need strong copyright protections to earn a fair return on their work and ensure continued job opportunities
Through legitimate sales and streams of creative works, Screen Actors Guild - American Federation of Television and Radio Artists (SAG-AFTRA) performers earned $1.11 billion (at an average amount of $229 per residual check), International Alliance of Theatrical Stage Employees (IATSE) behind-the-scenes professionals earned $510 million for their pension and health plan, the Directors Guild of America (DGA) distributed $460 million to directors and directorial team members, and writers, including members of the Writers Guild of America East (WGAE), earned $569 million in 2021. Revenue from authorized sales and licensing also funds the projects of tomorrow that these unions’ members count on for future jobs. Section 512 threatens present and future compensation – once unlicensed content is available on the internet, creative professionals suffer financial harm. Congress must reform Section 512 to ensure big tech can no longer use the law as a shield to avoid liability for a business model that profits at the expense of creative professionals.
Contact DPE Assistant to the President/Legislative Director Michael Wasser, mwasser@dpeaflcio.org, for more information.
Student Debt: A Critical Challenge Facing Professionals
2021 Fact Sheet
Highlights:
In 2021, 42.9 million Americans owed approximately $1.59 trillion in federal student loans, with an additional $138 billion in private student loans owed to banks and other financial institutions.
Among bachelor’s degree holders, women, Black, and Latinx students are more likely to have taken out student loans to finance their education, and they have higher average loan balances compared to other undergraduate borrowers.
Unions of professionals are taking action to help solve the student debt crisis and increase access to flexible repayment and forgiveness programs, including Public Service Loan Forgiveness.
As the U.S. economy moved into the 21st century, higher education increasingly became a requirement for many in order to start their careers and access the nearly twelve million jobs in professional occupations that have been created over the last decade.[1] [2] While bachelor’s or graduate degrees were required for 21 percent of all jobs before the great recession in 2006, they are now required for 28 percent of all jobs in the United States and jobs requiring bachelor’s, master’s, doctoral, or professional degrees are projected to continue growing faster than overall employment.[3]
But during this timeframe, the cost to attend private and public four-year colleges and universities has also increased dramatically. During the 1999-2000 school year, the average annual cost of attending a 4-year college or university (public or private), was $10,697 in 2019 dollars. Twenty years later, average tuition and fees had increased to $16,647.[4] At the same time, real median weekly earnings for college graduates only increased 5.25 percent.[5] This 56 percent increase in inflation-adjusted costs reflects a trend at both public and private institutions of higher education where tuition has skyrocketed, leading a majority of undergraduate students to take out many thousands of dollars in loans per year to finance their educations. As of March 31, 2021, the total outstanding federal student loan balance in the United States was $1.59 trillion, reflecting an overall 80 percent increase in aggregate student debt in 10 years.[6]
|
Average Undergraduate Tuition and Fees, constant 2019-2020 dollars [i] |
|||||
|
Institution Type |
2019-2020 |
2009-2010 |
1999-2000 |
% change over 10 years |
% change over 20 years |
|
Public, in-state, 4-year |
$ 9,349 |
$ 7,972 |
$ 5,088 |
17 % |
84 % |
|
Private, 4-year |
$ 32,769 |
$ 26,430 |
$ 22,208 |
24 % |
48 % |
|
Average, public and private, 4-year |
$ 16,647 |
$ 14,722 |
$ 10,697 |
13 % |
56 % |
|
Public, 2-year (Community College) |
$ 3,377 |
$ 2,710 |
$ 2,0486 |
25 % |
36 % |
Demographics of Student Loan Borrowers
Student debt is a widespread problem in the United States and student loans make up the largest portion of non-housing consumer debt. However, it does not affect all demographic groups equally.
Gender
Women are now a growing majority of college graduates and made up 57.8 percent of the graduating class of 2020-2021.[8] However, among bachelor’s degree recipients, more women (71.1 percent) take out student loans to finance their undergraduate educations than men (63.9 percent) and their average undergraduate loan balance among those who borrowed to finance their undergraduate education is slightly higher as well ($31,700 compared to $29,400).[9]
However, female graduates in the class of 2015-2016 had a lower median monthly student loan payment ($180) than men ($200), and were slightly more likely (79.5 percent) to be in active repayment 12 months after graduating than men (79.1 percent).[10] Women report experiencing very high, high, or moderate levels of stress due to their education debt at an increased rate (77.9 percent) compared to men (65 percent), though it is important to note that a majority of all borrowers reported significant levels of debt-related stress.[11]
Four years after graduation, women are also less likely than men to have paid off their loans or had their balances forgiven. Of those who borrowed to finance their education in the class of 2008, 15.7 percent of men had their loans paid off or forgiven by 2012, while only 11.8 percent of women had done the same.[12] Women had also defaulted on their loans at a higher rate than men (3.7 percent vs. 3.3 percent) and more women were deferring payments on their loans (19.1 percent vs. 14.4 percent). It is important to note, however, that women’s higher rate of deferment may in part be attributed to the higher percentage of women who enrolled in an additional degree program after graduating with their bachelor’s degrees (46.6 percent vs. 39.4 percent).[13]
Race
While the majority of bachelor’s degree graduates hold some level of student debt, their experiences can vary significantly depending on their race. More Black and Latino graduates took out loans to finance their undergraduate educations than white or Asian American students, and Black students, on average, took out larger loan balances to pay for undergraduate tuition. Four years after graduation, Black and Asian American graduates had higher total student loan balances, which can be partially attributed to the fact that more Black and Asian American students pursued additional postgraduate education compared to their white and Latino peers.
|
Student Loan Statistics by Race |
|||
|
Percent of new graduates who took out loans, Class of 2016 |
Average amount borrowed for bachelor’s degree, Class of 2016 |
Average total borrowed for all education, 4 years after graduating with a bachelor’s degree, Class of 2008 |
|
|
White |
67.7 % |
$ 29,900 |
$ 44,256 |
|
Black |
86.3 % |
$ 39,500 |
$ 58,487 |
|
Latino |
70.1 % |
$ 28,200 |
$ 44,675 |
|
Asian American |
43.9 % |
$ 26,500 |
$ 50,755 |
Additionally, Black and Latino graduates are more likely than other graduates to have defaulted on a federal or private student loan at some point during repayment, illustrating the greater challenges they face after graduation, including the racial wage gap. Other data shows how, over the long term, Black borrowers struggle to make a meaningful impact on their student debt load, with nearly two-thirds of Black borrowers still owing more than 100 percent of their original loan balance twelve years after starting school.
|
Student Loan Statistics by Race |
|||
|
Percent of new graduates who took out loans, Class of 2016 |
Average amount borrowed for bachelor’s degree, Class of 2016 |
Average total borrowed for all education, 4 years after graduating with a bachelor’s degree, Class of 2008 |
|
|
White |
67.7 % |
$ 29,900 |
$ 44,256 |
|
Black |
86.3 % |
$ 39,500 |
$ 58,487 |
|
Latino |
70.1 % |
$ 28,200 |
$ 44,675 |
|
Asian American |
43.9 % |
$ 26,500 |
$ 50,755 |
The Impact of High Levels of Student Debt
Job Selection and Satisfaction
High levels of debt can shift the way new graduates think about the job market and job satisfaction. Those with higher levels of debt are more likely to prioritize higher wages over job satisfaction and are more likely to start searching for new jobs while employed.[19] Data about job satisfaction points to higher levels of dissatisfaction among borrowers with more than $30,000 in undergraduate loans (41 percent unsatisfied or slightly unsatisfied) when compared to all undergraduate borrowers (38 percent) and those without undergraduate loans (30 percent).[20]
While student loan assistance is a top priority for young adult job seekers (third behind health insurance and paid time off), only eight percent of employers report offering any type of aid to employees who are paying back loans.[21]Importantly, employers are now able to provide up to $5,250 annually in tax-free student loan assistance to employees, thanks to a provision in the 2020 CARES act, extended through 2025 in the Consolidated Appropriations Act of 2021.[22]
Delaying Financial Goals
With total student debt balances topping $1.5 trillion, many Americans have been delayed from reaching milestones that could help them build financial stability. In a recent survey of Americans with student loan debt, 34 percent said they have delayed building emergency savings, 29 percent have delayed saving for retirement, and 27 percent are putting off payments on other forms of debt (including credit card debt). Additionally, 23 percent of borrowers said they were delaying buying a house, 10 percent said they were delaying having children, and nine percent said they were delaying marriage.[23]
The Government’s Failure to Protect Borrowers
The vast majority (92%) of student debt is held in the form of federal student loans.[24] These loans are funded by the Department of Education, but the responsibility for billing and collection is contracted out to private companies known as loan servicers. Loan servicers manage accounts, process monthly payments, manage repayment programs, and are the primary customer service contact for borrowers. But instead of helping borrowers, many report that these companies often make it harder for them to pay back their loans.
In 2015, the Consumer Financial Protection Bureau (CFPB), the Department of Education, and the Department of the Treasury launched an investigation of student loan servicing practices. More than 30,000 borrowers responded to a solicitation of public comments, detailing servicer practices that did not serve the best interests of borrowers. This included discouraging borrowers from enrolling in alternative repayment plans (such as income-driven repayment), poor customer service, and inaccurate payment processing.[25]
But despite the comprehensive list of reforms proposed in the CFPB report, federal policy has not changed significantly and loan servicers continue to poorly serve borrowers. A 2019 report from the Department of Education Inspector General found that not only were loan servicers not following the rules governing the federal student loan program, but the Department of Education was not holding them responsible for noncompliance. The Department of Education’s lack of enforcement has allowed all nine loan servicing companies to profit while failing to provide adequate services for borrowers and has not provided any incentive for these companies to change their practices.[26]
And though the Department of Education has programs to help graduates pay back their loans if they chose to work in certain fields, these programs have so far failed to help the vast majority of prospective beneficiaries. The Public Service Loan Forgiveness program (PSLF), created in 2007, promises to forgive the remaining balance on all federal student loans after a person works for 10 years for federal, state, or local governments or qualified 501(c)3 organizations and makes 120 regular payments on their loans. But when the first cohort of borrowers applied for loan forgiveness in 2018, less than one percent of them were approved by the Department of Education (96 out of 28,000 applications).[27]
To fix this problem and fulfill the promise of PSLF, in October 2021, Education Secretary Michael Cardona announced a widespread overhaul of the Public Service Loan Forgiveness program designed to lower the barriers that had led many borrowers’ forgiveness applications to be rejected, including a temporary one-year waiver to allow borrowers to count payments on loans that otherwise would not qualify towards credit for forgiveness.[28] In November 2021, the Department of Education announced that 30,000 borrowers would be immediately receiving approximately $2 billion in forgiveness thanks to these changes, with many more likely to benefit in the future.[29]
How Unions Are Addressing the Student Debt Crisis
As student loan assistance has become a top priority for young adult job seekers, unions are also responding to the growing debt crisis by advocating for change, educating and engaging their membership, and bargaining for employer-provided relief.
Advocating for Change
Partly because of the high rates of student debt among their membership and partly because of their members’ role in the education system, the American Federation of Teachers (AFT) has taken an active role in legal and legislative advocacy to help student loan borrowers, especially those eligible for Public Service Loan Forgiveness (PSLF).
Thanks in great part to the advocacy of AFT, the American Federation of Government Employees (AFGE), and other unions, the Department of Education’s overhaul of PSLF will help thousands of union members secure immediate loan forgiveness, or greatly lessen the time to reach forgiveness.[30] These unions are working to educate their members about the temporary PSLF waiver that ends in October 2022, so that as many members as possible can benefit from the opportunity to enroll in this important program.
AFT, as well as many other unions, have also endorsed legislative solutions for widespread loan forgiveness proposed by Senators Bernie Sanders (I-VT), Elizabeth Warren (D-MA), and others.
Educating Union Members
Unions have also been playing an important role in educating their members about the resources available to them as student loan borrowers. Multiple unions in the arts and entertainment industries, such as SAG-AFTRA and Actors’ Equity, have held workshops on managing student debt, with an eye to the unique circumstances their members face as creative professionals. AFT’s student debt clinics emphasize the importance of PSLF and give tips to members for enrolling in the program and eventually receiving debt forgiveness. AFT also sponsors ForgiveMyStudentDebt.org in order to share information about PSLF with the broader community of public service professionals.
Bargaining for Repayment Assistance
While many union contracts contain provisions ensuring employers help pay for additional education that professionals may be required or encouraged to pursue, a new demand by some unions is to make loan repayment assistance available to employees who already completed either their undergraduate or graduate degrees. For example, Office and Professional Employees International Union (OPEIU) Local 8 members who work at the Northwest Justice Project (a legal aid organization) negotiated for loan repayment assistance for staff attorneys who make under a certain salary threshold and members of the Nonprofit Professional Employees Union, IFPTE Local 70 at the nonprofit Every Texan negotiated for a stipend of up to $200 per month to help individual union members make the required monthly payments on their loans for up to five years.[31] In healthcare, AFT members at Natchaug Hospital in Connecticut negotiated for up to $3,000 of student loan repayment assistance for registered nurses in their second and third years of service. And in the federal sector, some bargaining units of the AFGE and International Federation of Professional and Technical Engineers (IFPTE) have enshrined the Office of Personnel Management’s student loan repayment program into their collective bargaining agreements in order to create a role for the union to ensure the program is applied fairly.
Looking to the Future
Without large-scale federal legislation, the student debt crisis in the United States is not likely to go away anytime soon. Professionals will continue to need accurate advice and guidance with regard to their student loans, and union professionals will likely look to their unions for assistance. Unions looking for resources on how to bargain for student loan repayment assistance and other ways to assist members with their student debt can contact DPE.
December 2021
[1] Bureau of Labor Statistics. “Household Data 2010 Annual Averages: Table 9. Employed persons by occupation, sex, and age.” 2010. https://www.bls.gov/cps/cps_aa2010.htm
[2] Bureau of Labor Statistics. “Household Data 2020 Annual Averages: Table 9. Employed persons by occupation, sex, and age.” 2020. https://www.bls.gov/cps/cpsaat09.htm
[3] Bureau of Labor Statistics. “Employment, wages, and projected change in employment by typical entry-level education”. September 2021. https://www.bls.gov/emp/tables/education-summary.htm
[4] National Center for Education Statistics. Digest of Education Statistics. “Table 330.10 Average undergraduate tuition and fees and room and board rates charged for full-time students in degree granting postsecondary institutions, by level and control of institution: Selected years.” https://nces.ed.gov/programs/digest/d20/tables/dt20_330.10.asp
[5][5] Federal Reserve Bank of St. Louis. FRED Economic Data. “Employed full time: Median usual weekly nominal earnings (second quartile): Wage and salary workers: Bachelor's degree and higher: 25 years and over.” https://fred.stlouisfed.org/series/LEU0252918500A
[6] Federal Reserve Bank of New York. Center for Microeconomic Data. “Household Debt and Credit Report.” August 2021. https://www.newyorkfed.org/medialibrary/interactives/householdcredit/data/pdf/HHDC_2021Q2.pdf
[7] National Center for Education Statistics.
[8] National Center for Education Statistics. Digest of Education Statistics. “Degrees conferred by degree-granting institutions, by level of degree and sex of student.” Retrieved from https://nces.ed.gov/programs/digest/d12/tables/dt12_310.asp
[9] This data reflects averages for the 2015-2016 bachelor’s degree graduating class, from Thomsen, Erin, Peterson, CHarlotte, Velez, Erin Dunlop, and RTI International. “One Year After a Bachelor’s Degree: A Profile of 2015–16 Graduates.” National Center for Education Statistics. July 2020. https://nces.ed.gov/pubs2020/2020341.pdf
[10] Ibid.
[11] National Center for Education Statistics. “Debt After College: Employment, Enrollment, and Student-Reported Stress and Outcomes.” March 2018. https://nces.ed.gov/pubs2018/2018401.pdf
[12] Cataldi, Emily Forrest; Staklis, Sandra; Woo, Jennie; and RTI International. “Four Years Later: 2007–08 College Graduates’ Employment, Debt, and Enrollment in 2012.” National Center for Education Statistics. June 2018. https://nces.ed.gov/pubs2018/2018435.pdf
[13] Ibid.
[14] “One Year After a Bachelor’s Degree: A Profile of 2015–16 Graduates.”
[15] Ibid.
[16] “Four Years Later: 2007–08 College Graduates’ Employment, Debt, and Enrollment in 2012.”
[17] NCES PowerStats. U.S. Department of Education, National Center for Education Statistics, Baccalaureate and Beyond: 2008/2018 (B&B). Table number nyagam
[18] Hueselman, Mark. “Yes, Student Debt Cancellation Would be a Big Deal.” Demos. November 19, 2020. https://www.demos.org/blog/yes-student-debt-cancellation-would-be-big-deal
[19] Luo, Mi & Mongey, Simon. “Assets and jobs choice: student debt, wages and amenities.” National Bureau of Economic Research. May 2019. https://www.nber.org/papers/w25801.pdf?sy=801
[20] Huelsman, Mark. “The Debt Divide.” Demos. 2015. http://www.demos.org/sites/default/files/publications/The%20Debt%20Divide.pdf
[21] Miller, Stephen. “Younger workers put student loan aid near top of desired benefits.” SHRM. June 5, 2019. https://www.shrm.org/resourcesandtools/hr-topics/benefits/pages/younger-workers-seek-student-loan-aid-and-career-development.aspx
[22] Grensing-Pophal, Lin. “Employers' Student Loan Assistance Tackles the College Debt Crisis.” SHRM. May 25, 2021. https://www.shrm.org/resourcesandtools/hr-topics/benefits/pages/employers-student-loan-assistance-tackles-the-college-debt-crisis.aspx
[23] Smith, Kelly Anne. “Survey: Student loan debt delays major financial milestones for millions.” Bankrate. February 27, 2019. https://www.bankrate.com/loans/student-loans/student-loans-survey-february-2019/
[24] Miller, Ben, Campbell, Colleen, Cohen, Brent & Hancock, Charlotte. “Assessing the $1.5 trillion in federal student loan debt.” Center for American Progress. June 2019. https://www.americanprogress.org/issues/education-postsecondary/reports/2019/06/12/470893/addressing-1-5-trillion-federal-student-loan-debt/
[25] “Student loan servicing: Analysis of public input and recommendations for reform.” Consumer Financial Protection Bureau. September 2015. https://files.consumerfinance.gov/f/201509_cfpb_student-loan-servicing-report.pdf
[26] “Federal Student Aid: Additional actions needed to mitigate the risk of servicer noncompliance with requirements for servicing federally held student loans.” U.S. Department of Education Office of the Inspector General. February 2019. https://www2.ed.gov/about/offices/list/oig/auditreports/fy2019/a05q0008.pdf
[27] Miller, Ben. “The answers needed on public service loan forgiveness denials.” Center for American Progress. November 2018. https://www.americanprogress.org/issues/education-postsecondary/news/2018/11/30/461660/answers-needed-public-service-loan-forgiveness-denials/
[28] U.S. Department of Education. “U.S. Department of Education Announces Transformational Changes to the Public Service Loan Forgiveness Program, Will Put Over 550,000 Public Service Workers Closer to Loan Forgiveness.” October 6, 2021. https://www.ed.gov/news/press-releases/us-department-education-announces-transformational-changes-public-service-loan-forgiveness-program-will-put-over-550000-public-service-workers-closer-loan-forgiveness
[29] Turner, Corey. “Thousands of borrowers' student debt is erased with loan forgiveness program overhaul.” National Public Radio. November 16, 2021. https://www.npr.org/2021/11/16/1056263613/thousands-of-borrowers-student-debt-is-erased-with-loan-forgiveness-program-over
[30] American Federation of Teachers. “A ray of hope for massive student debt relief.” October 7, 2021. https://www.aft.org/news/ray-hope-massive-student-debt-relief
[31]Nonprofit Professional Employees Union. “Every Texan Ratifies Union Agreement, First NPEU Contract in Texas and Any Right-to-Work State.” August 16, 2021. https://npeu.org/news/2021/8/16/every-texan-ratifies-union-agreement-first-npeu-contract
Intellectual Property Theft: A Threat to Working People and the Economy
2021 FACT SHEET
Highlights:
Copyright protections secure the current and future pay and benefits for over five million creative professionals working in motion picture and television production, live and recorded music, and theater and other performing arts.
Digital theft has a direct negative impact on creative industries and the professionals who work in them, with a cost of at least 290,000 jobs and $29 billion in lost revenue in the film and television industry alone.
Outdated laws such as Section 512 of the Digital Millennium Copyright Act need to be reformed to prevent big corporations from profiting from the unlicensed use of copyrighted works.
Creative industries - including motion pictures, television, theater and music - directly employ millions of Americans, bolster local economies, and generate substantial export revenues. Many of the union professionals who imagine, develop, design, and give life to creative content depend on legitimate sales and licensing of these works for their collectively bargained pay and contributions to their health insurance and pension plans.
Stolen or otherwise illegitimate content undermines the value of creative professionals’ work and threatens their hard-won pay and benefits. The theft and unlicensed distribution of copyrighted films, television shows, recorded music and live performances also costs the American economy billions of dollars every year. And in today’s digital age, creative works are now able to be stolen and transmitted illegally at rapid speeds and in ever increasing quantities. Strong copyright protections appropriate for the 21st century are necessary to protect middle class professionals’ economic security and protect the future of the creative industries.
The Economic Engine of Creative Industries
Copyright-protected creative industries power local economies across the United States, contributing more than $1.5 trillion to the nation’s gross domestic product every year, about 7.4 percent of the total U.S. economy. In 2019, these industries employed 5.7 million people, many in good union jobs with family-sustaining wages.[1]
|
Core Copyright Industries |
Total U.S. Economy |
|
|
Economic Growth, 2016-2019 |
5.87% |
2.48% |
|
Trade Balance, 2020 |
$70.8 billion |
- $616.1 billion |
Copyright Protections Support Millions of Jobs
The creative workforce consists of millions of people working in many different middle-class occupations, both in front and behind the camera, on and off stage.[6] [7] [8] These creative professionals rely on copyright protections and royalty or residual payments to make a living, provide healthcare for their families, and retire with security.
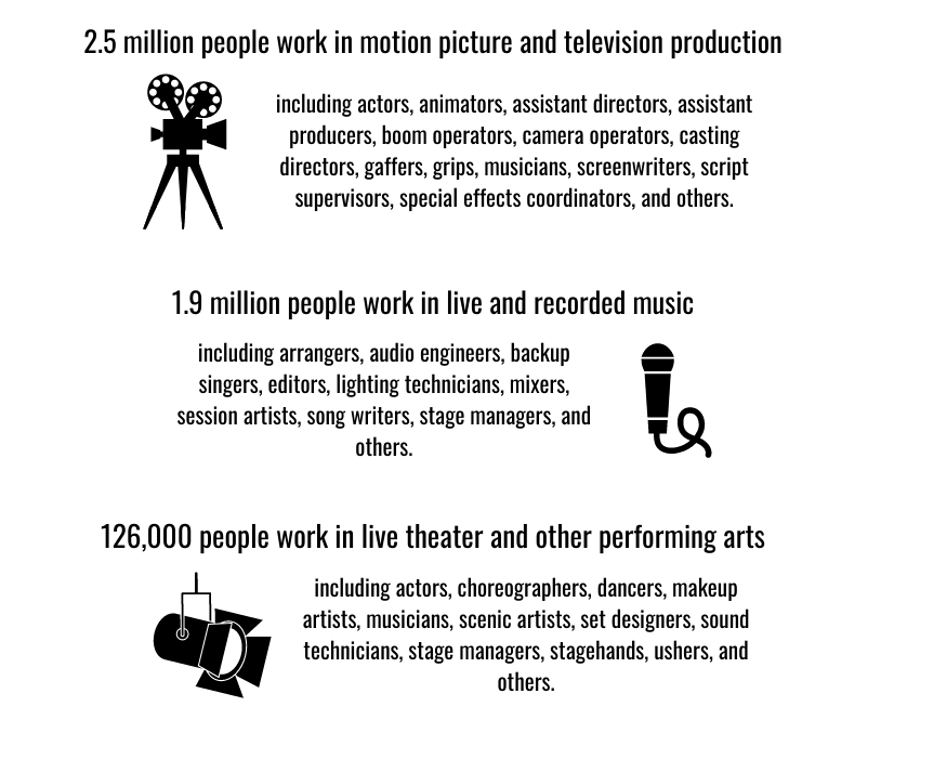
Through their unions, creative professionals have secured their rights as a largely freelance workforce, ensuring they are able to succeed alongside the industry as a whole. Indeed, through collective bargaining, creative professionals and their unions have won wages that outpace working professionals in other parts of the economy.
Unions representing professionals across the entertainment industries include Actors’ Equity Association, the American Federation of Musicians, the American Guild of Musical Artists, the American Guild of Variety Artists, the Directors Guild of America, the Guild of Italian American Actors, the International Alliance of Theatrical Stage Employees, Motion Picture Technicians, Artists and Allied Crafts, the International Brotherhood of Electrical Workers, the Office and Professional Employees International Union, the Screen Actors Guild - American Federation of Television and Radio Artists, the Stage Directors and Choreographers Society, and the Writers Guild of America, East.
The Damage to Creative Professionals
“Content theft undercuts the right to a fair share of profits that union professionals across the entertainment industry have fought for and won. When consumers pay to experience our members’ work in films, television shows, and songs, the union professionals who helped create the content get fair pay and health and retirement benefits. It’s simple: strong copyright laws support good union jobs.”
Digital theft hurts the millions of Americans who make a living and provide for their families through careers in the creative industries.
Intellectual property theft cuts into the resources available to employ people in the entertainment industry and other copyright-protected industries. While difficult to quantify, one study found that illegal downloads and streaming of film and television productions results in the annual loss of at least 230,000 jobs and $29.2 billion in economic activity.[9]
Intellectual property theft also reduces the real earnings of professionals already working in creative industries. While not typically the copyright holders themselves, when an individual receives credit on a production, they may be entitled to compensation if the material is used beyond its original exhibition. For example, residual payments begin for a credited cast or crew member on a television production “once a show starts re-airing or is released to video/DVD, pay television, broadcast TV, basic cable, or new media.” Other creative professionals, such as recording artists, song writers, and musicians, receive royalties from the sale, distribution and public performance of their creative work.
Depending on a creative professional’s specific role in a production, residual or royalty payments may be paid directly to the professional as compensation, or as contributions towards the professional’s health and pension fund. These payments are a significant portion of creative professionals’ total pay and benefits. In 2021, Screen Actors Guild - American Federation of Television and Radio Artists performers earned $1.11 billion (at an average amount of $229 per residual check), International Alliance of Theatrical Stage Employees behind-the-scenes professionals earned $510 million for their pension and health plan, the Directors Guild of America distributed $460 million to directors and directorial team members, and writers, including members of the Writers Guild of America East, earned $569 million.
As the unions who represent creative professionals work to expand opportunities in these industries and expand the creative workforce to include more Black, Latinx, Asian-American, and Native professionals, it is essential that there be strong copyright protections that these individuals can depend on for their pay and benefits. Too often creative professionals of color, women, and other marginalized individuals are not able to realize the full economic value of their intellectual property, an impediment to maintaining a career that utilizes their unique talents and abilities.
Intellectual Property Theft Continues to Grow
Because current copyright policy fails to match the realities of today’s digital age, intellectual property theft continues to threaten the economic security of creative professionals. The emergence of new legal paid streaming services such as Netflix, Hulu and Spotify has not reduced the scourge of digital theft; data indicates this type of theft is more popular than ever.
“When our work is stolen, we’ve been robbed of our living. We are artists, but we are also working people who depend on the intellectual property that we create to pay for our homes, families, health care, and more.”
Globally, the digital theft of music, television, film, software and other published works rose dramatically over the course of the COVID-19 pandemic. As quarantines and lockdowns spread across the globe in March 2020, digital theft surged by over 33 percent worldwide.[10]
Worldwide, there were 130.5 billion visits to websites that facilitate the theft of creative content in 2020, or about 39 visits per person with access to an internet connection. The United States topped the list of countries with the most visits to these websites, followed by Russia, China, India, and Brazil.
In particular, illicit streaming websites are able to take advantage of the popularity and ease of use of legal streaming platforms to more easily distribute unlicensed content, which is often stolen directly from legal streaming platforms and disguised to look legitimate. In 2020, illegal streaming sites were the destinations of 93 percent of visits to illegal TV distribution websites and 52 percent of visits to illegal film distribution websites.[11] And because newer illegal streaming sites are compatible with mobile devices in a way that peer-to-peer and the other older “file sharing” mechanisms were not, online copyright crime is poised to continue growing as consumers rely more and more on mobile devices.
Digital Theft Replaces Legitimate Sales
Data from natural experiments demonstrate how digital theft of creative content displaces legitimate sales and licensing, depriving creative professionals of appropriate compensation.
In 2012, the U.S. Department of Justice shutdown the website Megaupload, which hosted large volumes of stolen movies, television shows and music, and the site’s owners were arrested and indicted on multiple charges of copyright infringement. Prior to its shutdown, Megaupload was estimated to have been the Internet’s 13th largest website.[12] In the months following the website’s removal, legitimate digital movie sales revenue increased between 6.5 percent and 8.5 percent[13] Furthermore, the illegal distribution of films prior to their theatrical release has been shown to cause a 19.1 percent decrease in box-office revenue compared to films that only experienced post-release theft.[14]
“We make our living off of sheet music. We make our living off of digital music. There are ways to enjoy our music and download our music and purchase our music that supports the artists you love so much.”
The music industry is particularly susceptible to the harm caused by illicit downloading and ripping. For every 100 illegal downloads of music, 84 legal downloads are displaced.[15]
All sectors of the arts and entertainment industry are susceptible to intellectual property theft. Live theater is often “cinecast” in movie theaters to expand the number of people who are able to take in a show. Unfortunately, this opens theatrical productions to the same types of theft used to steal major motion pictures. Theatrical productions are also subject to illegally produced video recorded during live performances, stolen copies of sheet music and cast recordings, and illegally produced merchandise. When these works are stolen, there is a direct impact on the revenue that creative professionals rely on for their pay and benefits.
Other Threats to the Work of Creative Professionals
Outright theft is not the only way that copyright protections have been eroded and the work of creative professionals devalued.
The “value gap” is a term used to describe the growing disparity between the value that services such as YouTube derive from user-uploaded copyrighted content, such as a song uploaded in the background of an amateur video, and the revenue returned to the copyright holders, including musical artists. YouTube is the world’s largest on-demand music service, but it exploits a legal loophole in the Digital Millennium Copyright Act to avoid paying creators fairly for their work that is uploaded illegally by users. Payments to music creators from YouTube are less than 15 percent of the payments issued by popular streaming services Spotify and Apple Music.[16]
Another way copyright protections are being cheapened and creative professionals are cheated is through exploitation of the “fair use” doctrine beyond its intended purposes. The principle of fair use is meant to protect limited and transformative re-use in limited circumstances including criticism, reporting, teaching, scholarship, and research. However, a recent court case shows how some for-profit companies stretch the limits of fair use, to the detriment of content creators. In Fox News Network v. TvEyes, Inc, the cable news network sued the media monitoring service for distributing copyright-protected content to service subscribers without obtaining the proper licensing. While TV Eyes argued that their service (which costs subscribers $500 per month) was protected under the fair use exception, the Second Circuit Court of Appeals ruled in favor of Fox in February 2018.[17]
Defending U.S. Jobs and Benefits Requires Improving Copyright Laws
Intellectual property theft hurts working people and the entire U.S. economy. In today’s internet era, creative content can be transmitted across borders at speeds and in quantities few could imagine when our nation’s intellectual property protections were originally created.
“Strong copyright laws have protected the industry that fed me during my career as a below-the-line worker and have allowed me to retire with dignity.”
Strong copyright protections developed with today’s digital age in mind are needed to help ensure fair compensation for the professionals who imagine, develop, design, and give life to creative works that are responsible for supporting more than a trillion dollars in economic activity and millions of jobs.
Currently, outdated laws such as Section 512 of the Digital Millennium Copyright Act (DMCA) enable the largest companies in the world to build businesses that profit from the unlicensed use of copyrighted works without compensating their owners or contributing to the pay, health care, or retirement security of creative professionals. The U.S. Copyright Office recently found that Section 512 is “unbalanced.”[18] Congress must reform Section 512 to ensure big tech can no longer use the law as a shield to avoid liability for a business model that profits at the expense of creative professionals.
[1] Stoner, Robert and Jessica Dutra. “Copyright Industries in the U.S. Economy: The 2020 Report.” International Intellectual Property Alliance. https://www.iipa.org/files/uploads/2020/12/2020-IIPA-Report-FINAL-web.pdf
[2] Ibid.
[3] Ibid.
[4] U.S. Bureau of Economic Analysis. “Table 3.1. U.S. International Trade in Services.” September 21, 2021. https://apps.bea.gov/iTable/iTable.cfm?reqid=62&step=6&isuri=1&tablelist=51&product=1
[5] “Table 1.1. U.S. International Transactions.” Bureau of Economic Analysis. September 21, 2021. https://apps.bea.gov/iTable/iTable.cfm?reqid=62&step=6&isuri=1&tablelist=1&product=1
[6] “The Economic Contribution of the Motion Picture and Television Industry to the United States.” Motion Picture Association of America, Inc. February 2018.
[7] Siwek, Stephen E. “The U.S. Music Industries: Jobs & Benefits.” Recording Industry Association of America. April 2018.
[8] “National Industry-Specific Occupational Employment and Wage Estimates.” Bureau of Labor Statistics. May 2016.
[9] Blackburn, David, Eisenach, Jeffery and Harrison, David. “Impacts of Digital Video Piracy on the U.S. Economy.” NERA Economic Consulting and The U.S. Chamber of Commerce. June 2019. https://www.theglobalipcenter.com/wp-content/uploads/2019/06/Digital-Video-Piracy.pdf
[10] Muso. “Film and TV Piracy Surge During COVID-19 Lockdown.” June 2020. https://www.muso.com/magazine/film-tv-piracy-surge-during-covid-19-lockdown
[11] Muso. “Piracy in 2020.” 2021. https://www.muso.com/magazine/piracy-in-2020-a-snapshot-view
[12] Tsukayama, Hayley. “FAQ: What is Megaupload?” The Washington Post. January 20, 2012.
[13] Danager, Brett and Smith, Michael D. “Gone in 60 Seconds: The Impact of the Megaupload Shutdown on Movie Sales.” September 2013. SSRN.
[14] Ma, Liye, Montgomery, Alan L., Singh, Param Vir, and Smith, Michael D. “An Empirical Analysis of the Impact of Pre-Release Movie Piracy on Box-Office Revenue.” Information Systems Research, Forthcoming. July 8, 2014.
[15] Poort, Joost, Quintais, João Pedro, Ende, Martin van der, Yagafarova, Anastasia and Hageraats, Mathijs. “Global Online Piracy Study.” University of Amsterdam Institute for Information Law. July 2018.
[16] “Five Stubborn Truths About Youtube and The Value Gap.” RIAA News. August 18, 2017. https://www.riaa.com/medium-five-stubborn-truths-youtube-value-gap/
[17] Kim, Rachel. “Exploring the Bounds of Fair Use: Fox News v. TVEyes.” February 28, 2018. https://copyrightalliance.org/ca_post/fair-use-fox-news-v-tveyes/
[18] U.S. Copyright Office. “Section 512 Study.” May 21, 2020. https://www.copyright.gov/policy/section512/
The Union Difference for Working Professionals
2021 Fact Sheet
Highlights
Over six million union members working in professional occupations have better pay, benefits, and working conditions because they collectively bargain with their employers.
Union membership continues to narrow the gender pay gap for professional women.
In response to the impacts of the COVID-19 pandemic, union professionals have been able to negotiate for improved health and safety standards, financial assistance for extended work-from-home arrangements, and a say in how vaccine requirements and office re-openings are implemented.
What is Collective Bargaining?
Working professionals have the right to join together with their colleagues to form unions and negotiate with their employers on important workplace issues. Through the process of collective bargaining, employees are able to develop a binding contract that guarantees specific salaries, benefits, and other conditions of employment, just like the contracts that many CEOs have.
Over six million professionals benefit from collective bargaining agreements that protect their pay, benefits and working conditions, including doctors, nurses, lawyers, teachers, professors, research scientists, engineers, performers, technicians, administrative professionals, and many more in hundreds of other occupations.[i] No two union contracts are exactly alike, as professionals customize their collective bargaining agreements to meet their specific occupational needs and the context of their employers.
Joining together in union and negotiating with their employers allows professionals to speak with a collective voice that is stronger than any one person could hope to have. As a result, professionals who are union members are also able to have a greater role in shaping legislation and policy that impacts them and their industries.
Wages and Benefits
Through union membership and collective bargaining, professionals are able to negotiate over how wages are set and what benefits are provided to employees. Many collective bargaining agreements set guaranteed minimum salaries for various positions, as well as minimum annual pay increases. Individual employees are then free to negotiate for a higher salary based on individual performance, past experience, or other factors. For many professionals, union membership can make the difference between living paycheck to paycheck and earning enough to support their families.
Many writers, editors, and podcast producers have won wage increases and guaranteed minimums through their collective bargaining agreements as part of the Writers Guild of America, East (WGAE). For example, in their first contract ratified with Spotify in April 2021, writers, editors and other professionals at The Ringer established an entry-level salary floor of $57,000 plus overtime. Additionally, the producers, reporters, and other professionals at Gimlet Media established a floor of $73,000 for associate producers in their first contract, also ratified in April 2021. Both contracts also established annual minimum raises of at least 2 percent.[ii]
In April 2021, medical techs and therapists at St. Charles Medical Center in Bend, Oregon, ratified their first union contract after voting to unionize in 2019. These members of the Oregon Federation of Nurses and Health Professionals, an affiliate of the American Federation of Teachers (AFT), won average wage increases of 25 percent over three years and were able to establish a new wage system to fix long-standing inequities in pay.[iii]
Many professionals who work at non-profit organizations have organized new unions in recent years, in part to raise salaries and ensure that positions at their mission-driven organizations are accessible to all. Members of the Nonprofit Professional Employees Union (NPEU), International Federation of Professional and Technical Engineers (IFPTE) Local 70, who work at the research and advocacy organization Every Texan ratified their first contract in August 2021, winning a $15,000 increase to base salaries, a new monthly student loan repayment stipend of up to $200 per month, 16 weeks of paid parental leave, and 12 weeks of paid family and medical leave.[iv]
Across many professional occupations, professionals who are union members earn significantly more than their non-union colleagues.
|
Average yearly wage and salary earnings for union and non-union professionals working full-time in selected occupations, 2020 |
||
|
Occupation |
Union member annual earnings |
Non-union annual earnings |
|
Secondary School Teachers |
$69,057 |
$46,274 |
|
Registered Nurses |
$74,578 |
$67,326 |
|
Budget Analysts |
$97,808 |
$71,429 |
|
Child, Family and School Social Workers |
$49,547 |
$40,112 |
|
Aerospace Engineers |
$128,797 |
$95,256 |
|
Computer Support Specialists |
$113,851 |
$90,020 |
|
Librarians |
$38,032 |
$27,982 |
While it’s easy to see the impact of union membership and collective bargaining on wages, the process of collective bargaining also helps professionals win substantially better benefits, including lower health insurance premiums and better quality plans, larger retirement contributions, and more paid sick days, paid vacation time, and paid parental leave.[vi] Union professionals can also bargain for other priorities including professional development funds, flexible working hours, and remote work opportunities.
Union Membership Narrows the Wage Gap
While the gender pay gap is shrinking at far too slow of a pace, female professionals who are union members earn an average salary that is much closer to male professional union members when compared to their non-union counterparts. In 2020, professional women in unions earned 81 cents per dollar compared to professional men in unions. Non-union professional women only earned 75 cents for every dollar earned by men working in professional occupations.[vii]
Collective bargaining agreements help professionals narrow wage gaps by setting salary minimums and establishing clear criteria for how starting pay and subsequent raises should be calculated. Union professionals have also negotiated for their employers to conduct periodic pay equity studies and fix identified gaps. Employees of Thrillist Media won this kind of commitment in their second collective bargaining agreement, ratified in August 2021, which requires their employer to complete a pay equity survey within six months of contract ratification and share their results and methodology with the union. The contract also requires Thrillist to investigate and either rectify or explain pay differences of over 12 percent for employees in the same role.[viii]
Addressing Workplace Concerns Through Collective Bargaining
Though salaries and benefits are often the top concern of professionals, union members address many other workplace issues through the collective bargaining process.
Staffing levels and patient care are often big issues for nurses and other healthcare professionals. At McLaren Greater Lansing Hospital in Michigan, nurses who are members of Office and Professional Employees International Union (OPEIU) Local 459 have enshrined core staffing ratios into their collective bargaining agreement. The ratios vary based upon unit and shift and include a maximum of two patients per nurse in the critical care unit, as well as lump sum bonuses paid to affected staff in the event hospital management fails to meet staffing standards on a particular shift in a unit.[ix]
Large IT services companies that do third party contract work for U.S. corporations often move work overseas to cut costs, jeopardizing working standards for U.S. tech professionals. The Google contract workers employed by HCL America in Pittsburgh organized a union with the United Steelworkers (USW) in 2019. As part of their historic first contract ratified in July 2021, the software analysts were able to win language that protects their jobs from offshoring, negotiating for a required minimum number of bargaining unit positions that must be located in Pittsburgh and cannot be moved overseas.[x]
In public education, many teachers are working to improve class sizes and get support services in schools for students. In Los Angeles, members of the United Teachers of Los Angeles, AFT Local 1021 won important gains to improve the quality of education and help students who may need extra support, including a guarantee of nurses in every school every day, a librarian in every secondary school every day, and a guaranteed ratio of one counselor for every 500 students in secondary schools. They also won important gains to start lowering class sizes.[xi]
Another way collective bargaining agreements address workplace concerns is through the creation of Labor-Management Committees (LMCs). LMCs generally are made up of an equal number of union and management representatives, and are a venue for the union and the employer to discuss issues not specifically addressed in the contract. LMCs tend to be informal and protected settings where collaboration is valued and employee and employer concerns and ideas can be brought for resolution and feedback.
Making Industries More Inclusive
In many industries, professionals and their unions have prioritized increasing diversity, equity, and inclusion in the workplace by negotiating for workplace policies meant to disrupt past hiring practices and prevent discrimination in the workplace.
To address disparities in pay, AFT members at Rutgers University negotiated for a process to allow faculty members to apply for equity adjustments in order to address pay disparities based on race, ethnic identity, gender, or other protected categories.[xii]
Editorial staff at multiple outlets represented by the WGAE, including Gizmodo, HuffPost, and Slate have included provisions in their collective bargaining agreements to increase diversity in the newsroom. This includes a union-backed diversity committee that management is required to meet with regularly and a commitment to interviewing diverse candidates for open positions.[xiii]
Screen Actors Guild - American Federation of Television and Radio Artists (SAG-AFTRA) members who work in public radio have also made increasing diversity, equity, and inclusion a priority in bargaining. At WHYY in Philadelphia, union members negotiated for a first union contact that includes a process for creating a joint union-management committee that will not only be concerned with the development of a more diverse and equitable workforce, but also promoting equity in the way that the station engages with, covers and provides programming to the broader community.
Members of the Engineers and Scientists of California, IFPTE Local 20, working at the Centro Legal de la Raza bargained for the establishment of a diversity committee made up of union members and managers. The role of the committee is to participate in job interviews for open positions and exit interviews for departing staff, as well as to plan trainings and other events that advance the goal of recruiting, hiring and retention of a diverse staff and incubating leadership among staff members.[xiv]
Unfortunately, the essential work of creating more diverse and welcoming workplaces often falls to professionals as a secondary task in addition to their primary work responsibilities, without additional compensation. At the University of Michigan, graduate student workers who are members of AFT negotiated for the creation of dedicated, fully-paid positions for graduate employees to advance the union’s and university’s shared diversity, equity and inclusion goals.[xv]
Pushing Back Against Insecure Work Arrangements
Approximately 2.3 million professionals report that they do not expect their jobs to last or that their jobs are temporary.[xvi] However, through their unions, professionals have been pushing back against efforts to outsource work to contractors, and to turn careers into temporary or contingent work arrangements.
In April 2020, the Tennessee Valley Authority announced that it would be outsourcing internal software development work to several third party companies and laying off more than 200 TVA employees in the process.[xvii] The union that represents these professionals, IFPTE Local 1937, quickly jumped into action, rallying support for the restoration of these positions and opposition to the outsourcing plan, which would have required union members to train their replacements and help facilitate the offshoring of this work to other countries. Thanks to the actions of union members and leaders, their case rose in prominence, attracting enough attention to prompt the White House to act and reverse the outsourcing plan.[xviii]
The TVA’s original plan mirrors a trend where corporations, in their quest to boost profits, regularly replace American professionals with H-1B guest workers, often as an intermediate step before offshoring the work entirely. H-1B workers are typically paid below market wages. Additionally, employers control their visas and, therefore, their ability to live and work in the United States, which means H-1B workers are unlikely to speak up about poor working conditions or cooperate with authorities after a complaint has been filed. Engineers and other professionals in IFPTE have been working to reform the H-1B program to protect American professionals and the people working on H-1B visas, and to end the incentive that exists for corporations to use guest worker programs as a way to cut costs and lower industry standards.[xix]
At colleges and universities across the country, the rise of part-time, “adjunct” faculty has cut into the traditional roles that faculty have played in research, student mentoring, and school administration. Several unions, including AFT and USW, have been working with adjunct faculty members to win important gains that bring more stability to their lives, including higher per-class rates of pay and the assurance of continued employment semester-to-semester.[xx]
Working on political campaigns is notoriously unstable, and field organizers and other campaign professionals are often required to work long hours for low pay and with very little job security. However, in recent years, the employees of many individual candidates and state parties have begun to organize unions and negotiate collective bargaining agreements. Many of these new union members have joined the International Brotherhood of Electrical Workers (IBEW), and their contracts are setting new standards for campaign professionals, including paid vacations, holidays, overtime, and pay transparency.[xxi]
In journalism and digital media, the practice of hiring “permalancers” has taken hold among publishers. These professionals are hired on a full-time, temporary basis without any of the benefits provided to full-time staff, but are expected to work under the same conditions as a traditional full-time position. While labor law prohibits many freelancers from joining established unions, members of the WGAE are still working in solidarity with freelance writers. The collective bargaining agreement for staff at VICE News, for example, includes language that mandates management offer a permanent staff position to any freelancer who works at least 228 days in any 12-month period.[xxii]
Protecting Professionals During the COVID-19 Pandemic
As the COVID-19 pandemic spread across the United States and across the world, the way professionals work was immediately changed. For some, pandemic protocols meant working from home, other professionals in essential industries continued to perform their duties in-person but with new concerns about health and safety, and others were put out of work entirely due to the temporary pause of live events and performances. Faced with this situation, professionals and their unions were able to negotiate solutions to mitigate the impact of these changes.
For many professionals, COVID-19 led to a transition of working from home. However, many federal government employees had to continue working with the public in order to continue providing essential services. Early in the pandemic, as cases were still low in the United States, the union representing Transportation Security Officers, the American Federation of Government Employees (AFGE), started advocating for the rights of TSOs to wear N95 respiratory masks to protect against airborne viral transmission. Initially, this request was denied by the TSA administrator, David Pekoske, because he did not want to alarm the public. But as AFGE ramped up their pressure and the threat of COVID-19 became more apparent, Administrator Pekoske and the Trump administration finally agreed.
For those working in healthcare, such as the nurses and other professionals represented by AFT affiliate Health Professionals and Allied Employees (HPAE) in New Jersey, the pandemic has resulted in one crisis after another. A compounding factor was the lack of clear standards and enforcement from the Occupational Health and Safety Administration (OSHA). To force both OSHA and healthcare employers to do the right thing and prioritize the safety of healthcare professionals, members of HPAE and other AFT affiliate unions filed many complaints with OSHA, state, and local health departments, resulting in citations and fines against many employers. OSHA eventually conducted 25 investigations, and many of the facilities that were cited improved their safety practices, providing more training, better personal protective equipment, and medical evaluations for staff.[xxiii]
As it became clear that live events such as dance performances would not resume for many months, the dancers and stage managers represented by the American Guild of Musical Artists (AGMA) at the Alvin Ailey American Dance Theater were able to negotiate for a memorandum of understanding (MOU) to protect their pay and benefits, including health insurance, during the 2020-2021 season. The MOU also provided for a process to negotiate over alternative work assignments not normally performed by the artists.[xxiv]
After television and film productions were shut down completely for the first few months of the COVID-19 pandemic, SAG-AFTRA, International Alliance of Theatrical Stage Employees (IATSE), Directors Guild of America (DGA), and other production unions worked with leading studios in order to negotiate safety and health standards that would allow work to resume, which were then codified into contract language. These standards included testing, paid leave, protective personal equipment (PPE), social distancing on sets, and designated coronavirus safety officers. These standards have allowed film and television production to resume safely, detecting potential exposures early, and preventing large-scale outbreaks on sets.[xxv]
In the non-profit sector, members of the NPEU, IFPTE Local 70, have been negotiating agreements to help professionals adapt to the long term reality of work-from-home. At the National Women’s Law Center, union members were able to secure both lump-sum and recurring stipends to help cover the increased costs associated with working from home, contract extensions for term-limited staff whose positions were set to end in the middle of the economic downturn, and policies to ensure that employees and their union will have a role in office reopening decisions.[xxvi]
Many professionals have worked through their unions to make it easier for their coworkers to get vaccinated against COVID-19. At Augsburg University in Minnesota, OPEIU members negotiated an agreement that provides an additional 16 hours of paid sick leave for staff who get vaccinated, in order to have adequate time off to receive their dose(s) and recover from any side effects.
Millions of professionals have chosen to come together in union and negotiate collectively for better wages and benefits, for a say in important workplace decisions, and to improve the quality of their work and the industries they work in. It is important to note that no two collective bargaining agreements are the same. The type of workplace improvements addressed by a collective bargaining agreement is determined by the members who will be covered by the contract and their employer. Uniquely tailored collective bargaining agreements have resulted in the wide range of contract provisions covered in this fact sheet.
For answers to common questions about unions for professionals, see “I’m a Professional. What can a Union do for Me?”
October 2021
[i] For the purposes of this factsheet, professional occupations include all occupations that fall under the following major groups in the 2018 standard occupational classification system: management occupations, business and financial operations occupations, computer and mathematical occupations, architecture and engineering occupations, life, physical, and social science occupations, community and social service occupations, legal, educational instruction and library occupations, arts, design, entertainment, sports, and media occupations, and healthcare practitioners and technical occupations.
[ii] Writer’s Guild of America, East. “Gimlet Media and The Ringer Ratify First Podcast Contracts at Spotify.” April 7, 2021. https://www.wgaeast.org/gimlet-media-and-the-ringer-ratify-first-podcast-contracts-at-spotify/
[iii] Oregon Federation of Nurses and Health Professionals. “After Strike, Techs Win New Contract and Huge Wage Raises at St. Charles.” http://ofnhp.aft.org/news/after-strike-techs-win-new-contract-and-huge-wage-raises-st-charles
[iv] Nonprofit Professional Employees Union. “Every Texan Ratifies Union Agreement, First NPEU Contract in Texas and Any Right-to-Work State.” August 16, 2021. https://npeu.org/news/2021/8/16/every-texan-ratifies-union-agreement-first-npeu-contract
[v] Current Population Survey Annual Social and Economic Supplement. March 2020.
[vi] SAG-AFTRA members at National Public Radio ratified a new contract in 2021 that included up to 20 weeks of paid parental leave, up from eight weeks in the previous contract. See Falk, Tyler. “New NPR SAG-AFTRA contract expands parental leave, includes DEI provisions.” The Current. October 4, 2021. https://current.org/2021/10/new-npr-sag-aftra-contract-expands-parental-leave-includes-dei-provisions/
[vii] Department for Professional Employees analysis of Current Population Survey data for 2020.
[viii] Writers Guild of America, East. “Thrillist Ratifies Second Union Contract with Group Nine Media.” August 3, 2021. https://www.wgaeast.org/thrillist-ratifies-second-union-contract-with-group-nine-media/
[ix] “RN Agreement Between McLaren Greater Lansing and OPEIU.” September 11, 2019. http://www.local459.org/Contracts/MGL_RN_CBA_2019-2022.pdf
[x] Herring, An-Li. “Google Contract Workers Win First Labor Deal After Nearly 2 Years Of Negotiations.” WESA FM. July 29, 2021. https://www.wesa.fm/economy-business/2021-07-29/google-contract-workers-win-first-labor-deal-after-nearly-2-years-of-negotiations
[xi] United Teachers of Los Angeles. “Our Contract Agreement.” January 22, 2019. https://www.utla.net/sites/default/files/what%20we%20won.pdf
[xii] Rutgers AAUP-AFT. “Salary Equity Program.” https://rutgersaaup.org/salary-equity-program/
[xiii] Writers Guild of America, East. “Staff Contracts.” https://www.wgaeast.org/guild-contracts/staff-contracts/
[xiv] Engineers and Scientists of California Local 20, IFPTE. “Centro Legal de la Raza: 2019 Tentative Agreement.” https://www.ifpte20.org/centro-2019-ta/
[xv] American Federation of Teachers. “Grad employee union wins full pay for diversity work.” September 6, 2017. https://www.aft.org/news/grad-employee-union-wins-full-pay-diversity-work
[xvi] Bureau of Labor Statistics. Table 4. Employed contingent and noncontingent workers by occupation and industry, May 2017. June 7, 2018. https://www.bls.gov/news.release/conemp.t04.htm
[xvii] Cohen, Rachel. “Despite Skyrocketing Unemployment, Tennessee Valley Authority Plans to Outsource Hundreds of Federal Jobs to Overseas Companies.” The Intercept. May 5, 2020. https://theintercept.com/2020/05/05/tennessee-valley-authority-outsource-jobs-unemployment/
[xviii] International Federation of Professional and Technical Employees. “Statement by Leaders of IFPTE on President Trump's Executive Order Regarding TVA.” August 3, 2020. https://www.ifpte.org/news/statement-by-leaders-of-ifpte-on-president-trumps-executive-order-regarding-tva
[xix] Department for Professional Employees “Guest worker visas: The H-1B and L-1.” April 30, 2021 https://dpeaflcio.org/programs-publications/issue-fact-sheets/guest-worker-visas-the-h-1b-and-l-1/
[xx] American Federation of Teachers. “Report shows alarming poverty among adjunct faculty.” April 21, 2020. https://www.aft.org/news/report-shows-alarming-poverty-among-adjunct-faculty
[xxi] International Brotherhood of Electrical Workers. “A New Voice for Campaign Workers.” The Electrical Worker. October 2020. http://www.ibew.org/articles/20ElectricalWorker/EW2010/IBEW%20EW%20V14%20N10.pdf
[xxii] Writers Guild of America, East & Vice Media, LLC. Collective Bargaining Agreement. March 19, 2019. https://www.wgaeast.org/wp-content/uploads/sites/4/2019/03/VICE-News-WGAE-Agreement-2019-2021.pdf
[xxiii] American Federation of Teachers. “AFT’s health professionals push OSHA for a COVID standard.” May 4, 2021. https://www.aft.org/news/afts-health-professionals-push-osha-covid-standard
[xxiv] American Guild of Musical Artists and Alvin Ailey Dance Foundation, Inc. “Memorandum of Agreement.” September 2020.
[xxv] “COVID-19 Return to Work Agreement with DGA, IATSE, SAG-AFTRA and Teamsters / Basic Crafts” September 21, 2020. https://www.sagaftra.org/files/sa_documents/ReturnToWorkAgreement_wAMPTP.pdf
[xxvi] Reprojobs Team. “How we did it: Organizing for workplace safety measures during COVID.” Reprojobs. July 1, 2021. https://www.reprojobs.org/blog/nwlcunited-covid-mou
Racial Representation in Professional Occupations: By the Numbers
2021 Joint Fact Sheet
This fact sheet was jointly produced by the Economic Policy Institute and the Department for Professional Employees, AFL-CIO. The authors are Valerie Wilson, Melat Kassa, and Ethan Miller.
The racial wealth gap in the United States is staggering. While the median white family had about $184,000 in family wealth in 2019, the median Black family had only $23,000 in wealth and the median Latinx family had only $38,000.[i] This inequity has roots in many factors, including discriminatory governmental policies, generational wealth transfers, and the racial wage gap, which is fueled in large part by occupational segregation.
Black and Latinx representation in professional occupations
This occupational segregation is observed in the severe underrepresentation of Black and Latinx workers in professional occupations that pay more, on average, than other occupations.[ii] Over the next decade, eight of the 10 major groups of professional occupations are projected to have above-average job growth.[iii] If current disparities in employment patterns remain unchecked, racial disparities in the economy are likely to continue growing.
The data in Table 1 paint a clear picture of the current gap in representation for Black and Latinx workers in professional occupations overall.[iv] But Black and Latinx professionals are also unequally distributed across professional occupation groups. For example, community and social service occupations have much higher rates of representation of Black and Latinx professionals, while others, like legal occupations, lag significantly behind the professional workforce as a whole for both groups. The severe underrepresentation of Black professionals in architecture and engineering, as well as in life, physical, and social sciences, is also notable.
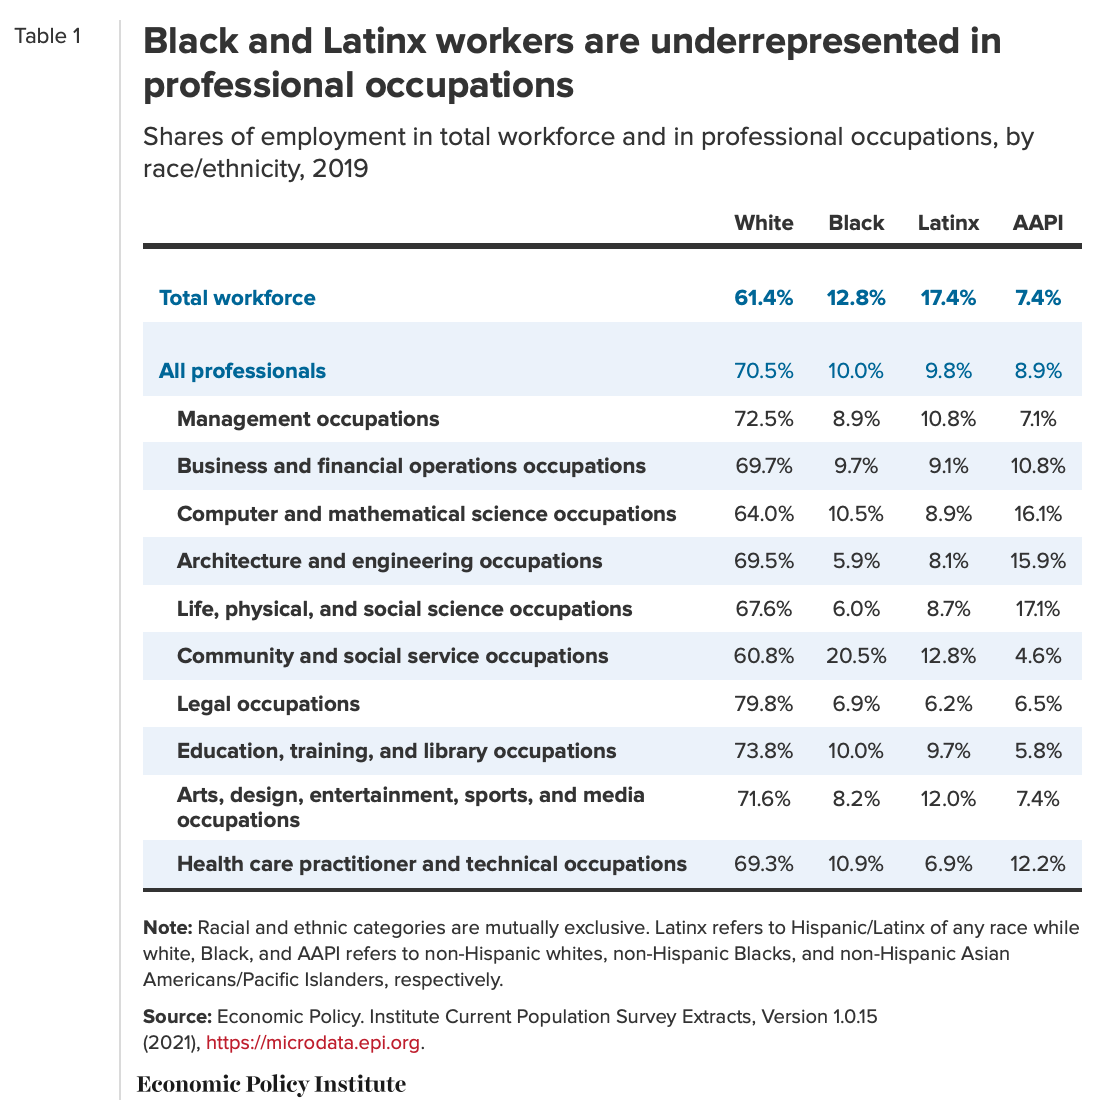
AAPI representation in professional occupations
While representation rates for Black and Latinx professionals generally follow similar patterns, representation for Asian American/Pacific Islander (AAPI) workers does not. As Table 1 shows, AAPI workers are overrepresented in several occupational groups that employ much smaller shares of Black and Latinx workers---especially STEM (science, technology, engineering, and math) and health care occupations---while they are underrepresented in those that employ larger shares of Black and Latinx workers, such as community and social service occupations and education, training, and library occupations.
Representation by sector
There are also clear differences in the employment of Black and Latinx professionals across broad sectors of the economy (Table 2). In the federal government and, to a lesser degree, in state and local governments, Black professionals are represented at much higher rates than in the private sector. Historically, the public sector has been a source of equitable job opportunities for Black professionals due to a combination of factors, including strong anti-discrimination and affirmative action regulations.[v] Latinx professionals are more likely to be employed in local government or for-profit private-sector companies.

Fast growth is projected in professional occupations—which may exacerbate inequality
Today’s inequities are of particular concern because several professional occupational categories are projected to grow at faster rates than the overall workforce. While the overall workforce is projected to grow by 3.7% from 2019–2029, the professional workforce is projected to grow at an average rate of 6.4%.[vi] In particular, computer and mathematical occupations, community and social service occupations, and health care practitioner and technical occupations are projected to grow at above-average rates.
Given underrepresentation of Black and Latinx workers in these occupations, and given that these occupations pay higher wages than other occupations, faster growth in these fields will exacerbate inequality if the problem of underrepresentation is not addressed.
While there has been some improvement in the representation rates of Black and Latinx professionals since the year 2000, the rate of change has been so slow that, if we continued at that rate, it would take 38 years to overcome the representational gap for Black professionals and 33 years for Latinx professionals.[vii] However, this does not take into account the fact that Black and Latinx shares of the overall workforce are projected to continue increasing over the next decade or more, lengthening the amount of time until this gap is overcome.[viii]
Pay disparities persist within professional occupations
On average, professionals are paid 44% more than the median wage earned by workers in all occupations. The underrepresentation of Black and Latinx workers in professional occupations is therefore an important factor in the racial wage gap. But there is a compounding factor: Black and Latinx workers who are in professional occupations still earn less than their white counterparts in similar occupations (Table 3).
Occupational segregation and discrimination are significant factors in explaining racial wage gaps, and these pay gaps are signs of the larger structural inequities that Black and Latinx professionals face in the workplace that impact related outcomes such as promotions, recruitment, and retention.[ix]
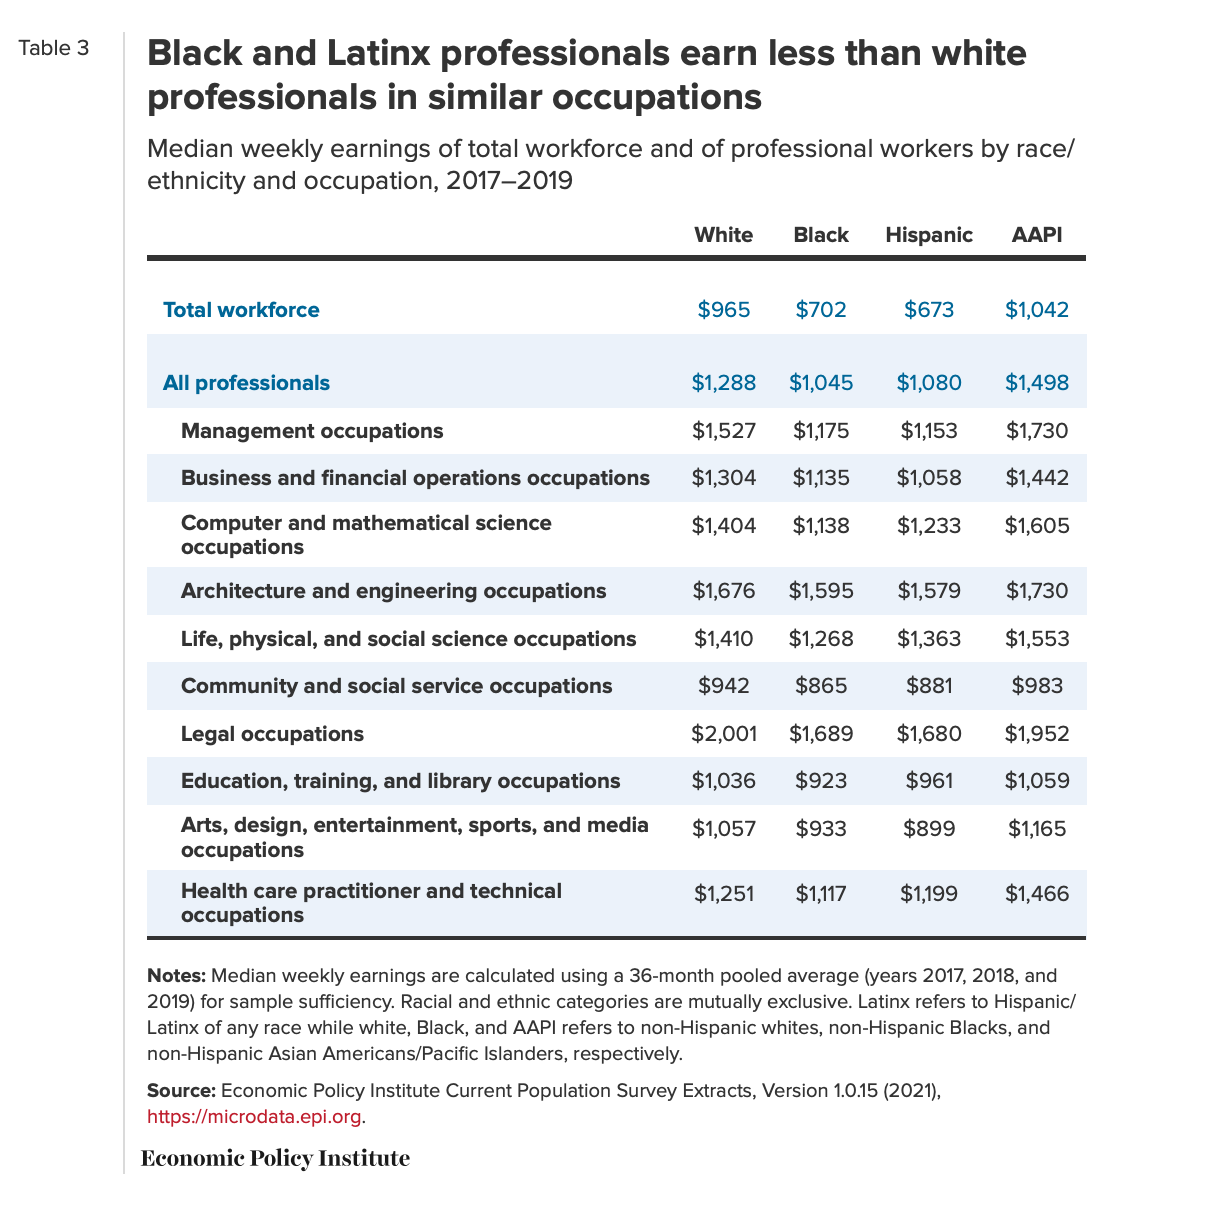
Policy recommendations
In order to close the professional representational gap at a faster rate and address other inequities in professional occupations, many changes are needed at the federal, state, local, and workplace levels. The following five recommendations are not an exhaustive list of the necessary changes but should be seen as a starting place for policymakers looking to tackle these challenges.
Increase the ability for professionals of all races and ethnicities to organize and join unions
Representation rates for Black and Latinx professionals are higher in jobs that are covered by union contracts. According to EPI analysis, Black professionals make up 10.9% of all professionals in unions compared with 9.6% of professionals not in unions, and Latinx professionals make up 10.4% of professionals in unions compared with 9.5% of professionals not in unions.[x] Union positions, on average, pay higher wages than nonunion jobs, and union contracts often have provisions that take subjectivity and bias out of the promotion and advancement process, increasing opportunities for Black and Latinx professionals to move up and remain in their chosen occupations.
While professionals of all races benefit from union coverage, the improvements won through a union are often greater for Black and Latinx workers: Among all occupations in 2019, Black workers who were covered by a union contract were paid 26.7% more than their nonunionized counterparts, and Latinx workers covered by a union contract were paid 35% more than their nonunionized peers. For comparison, the pay premium for all workers covered by a union contract in 2019 was 21.3%.[xi]
Union membership and collective bargaining empower professionals to challenge the workplace discrimination that contributes significantly to the underrepresentation of Black and Latinx professionals, especially in the tech sector. Research from the Kapor Center for Social Impact highlights how unfair treatment is the most frequent reason that Black and Latinx professionals leave tech jobs.[xii]
However, only 11.3% of professionals were union members in 2020.[xiii] U.S. labor law makes organizing new unions very difficult, and there are few, if any, negative consequences for employers who break the law to stop a union drive.
Significant reforms are needed to remove barriers to accessing the fundamental right to organize and bargain for improved working conditions and expanded opportunities for Black and Latinx professionals to be employed and advance in professional occupations.[xiv] The Protecting the Right to Organize (PRO) Act, introduced in Congress in 2021, would do just that by modernizing U.S. labor law and strengthening penalties for employers who break the law to discourage employees from organizing new unions.[xv]
Strengthen anti-discrimination laws in the private sector
While the representation of Black and Latinx professionals has increased over the last 20 years, their representation in the private sector lags significantly behind their representation in the public sector, as noted above.
Strengthening labor law and anti-discrimination policies are important steps toward creating a more equitable and diverse professional labor force in all sectors. The Restoring Justice for Workers Act, first introduced in Congress in 2019, would prohibit private-sector employers from requiring new hires to sign mandatory arbitration agreements.[xvi] Such agreements prevent working people from seeking justice through the judicial system for violations of their workplace rights, including Title VII of the Civil Rights Act, which prohibits employment discrimination based on race, color, religion, sex, and national origin.[xvii]
Workplace culture and rules are often shaped by the norms and practices of the racial majority, resulting in discrimination against those who are outside of those norms. One proposal to counter this type of workplace culture is the Create a Respectful and Open World for Natural Hair (CROWN) Act, which would protect against discrimination based on race-based hairstyles such as braids, locs, twists, and knots.[xviii]
Dismantle structures that perpetuate pay gaps
Large racial and gender wage gaps persist even when comparing workers with similar education, experience, and geographic location, revealing discrimination as a major factor.[xix] In 2016, the Equal Employment Opportunity Commission (EEOC) revised the Employment Information Report (EEO-1) to require large employers to report what they pay their employees by job category, sex, race, and ethnicity. This policy was introduced to strengthen enforcement of anti-discrimination laws and to draw employers’ attention to discriminatory pay disparities that may otherwise go undetected. Consistent and systematic collection of pay data also provides another layer of detail to existing reports of employment used to detect discriminatory hiring and promotion practices. However, in 2017, the Trump administration stayed the pay data collection rule, ending the reporting requirement. This rule needs to be reinstated.
An additional, complementary policy would prohibit employers from asking job candidates about previous pay history. As early as 2016, several states and localities began regulating the use of salary history during the hiring process.[xx] Implementing such a policy at the federal level would help to untether Black and Latinx professionals from lower levels of pay throughout their careers.
Remove barriers to job access for Black and Latinx professionals in STEM
The hiring of Black and Latinx professionals in science, technology, engineering, and math (STEM) fields lags behind hiring in other professional occupations. One possible barrier that contributes to this reality is the H-1B visa program, which allows employers to hire temporary migrant workers at below-market wages. Because their immigration status is controlled by their employers, it is difficult in practice for H-1B beneficiaries to seek out new jobs and it is difficult for them to exercise their workplace rights and advocate for better wages or improved working conditions.[xxi] According to the U.S. Department of Labor, H-1B workers account for approximately 10% of employment in information technology and, in certain key occupations---like software developers working on applications---they account for a remarkable 22%;[xxii] the share is likely even higher in certain geographies.
Since most employers are not required to advertise jobs to U.S. professionals before hiring through the H-1B visa program,[xxiii] they have access to a ready supply of underpaid and immobile workers and have little incentive to invest in recruitment, training, or retention initiatives for Black and Latinx professionals.
The H-1B visa program must be reformed to ensure that migrant workers have equal rights and are paid fairly. By uplifting labor standards in the H-1B program, we can ensure that it no longer serves as a barrier to Black and Latinx professionals accessing and retaining jobs in STEM occupations.[xxiv]
Increase federal arts funding and leverage tax incentives to create talent pipelines and encourage diverse hiring in the arts, entertainment, and media industries
The National Endowment for the Arts, the National Endowment for the Humanities, and the Corporation for Public Broadcasting help bolster local economies and put creative professionals to work on nonprofit productions and performances. Federal policymakers can help ensure that more of these career opportunities are available to underrepresented professionals by increasing federal arts funding overall and working with the unions that represent creative professionals to develop diversity-hiring requirements and reporting objectives for grant recipients. Additionally, Congress should follow the lead of states like Illinois, New Jersey, and New York to expand existing tax credits for American-based film, television, and live entertainment productions and identify effective diversity requirements for these tax incentives that will spur more inclusive hiring in film, television, and live entertainment.[xxv]
Notes
[i] Ana Hernández Kent and Lowell R. Ricketts, “Wealth Gaps Between White, Black and Hispanic Families in 2019,” On the Economy Blog (Federal Reserve Bank of St. Louis), January 5, 2021.
[ii] As defined by the Bureau of Labor Statistics, professional occupations include management occupations; business and financial operations occupations; computer and mathematical occupations; architecture and engineering occupations; life, physical, and social science occupations; community and social service occupations; legal occupations; educational instruction and library occupations; arts, design, entertainment, sports, and media occupations; and health care practitioner and technical occupations.
[iii] According to BLS projections, employment in all occupations is expected to grow 3.7% between 2019 and 2029. The major occupational groups expected to grow faster include community and social service occupations (12.5%); computer and mathematical occupations (12.1%); health care practitioner and technical occupations (9.1%); business and financial operations occupations (5.3%); legal occupations (5.1%); management occupations (4.7%); life, physical, and social science occupations (4.7%); and educational instruction and library occupations (4.5%). See “Table 1.1. Employment by Major Occupational Group, 2019 and Projected 2029,” Bureau of Labor Statistics Employment Projections, last updated April 9, 2021.
[iv] Because of the large and anomalous labor market fluctuations caused by the COVID-19 pandemic and economic recession in 2020, we base the analysis in this fact sheet on data from 2019 and earlier.
[v] David Cooper and Julia Wolfe, “Cuts to the State and Local Public Sector Will Disproportionately Harm Women and Black Workers,” Working Economics Blog (Economic Policy Institute), July 9, 2020.
[vi] “Table 1.1. Employment by Major Occupational Group, 2019 and Projected 2029,” Bureau of Labor Statistics Employment Projections, last updated April 9, 2021.
[vii] Economic Policy Institute Current Population Survey Extracts, Version 1.0.15 (2021). Annual rate of change is based on authors’ analysis of the change in representation of Black and Latinx workers in professional occupations from 2000 to 2019 and their overall representation in the workforce in 2019. In the year 2000, white professionals made up 80.3% of the entire professional workforce, with Black and Latinx professionals making up just 8.5% and 5.2%, respectively.
[viii] Bureau of Labor Statistics, “Hispanic Share of the Labor Force Projected to Be 20.9 Percent by 2028,” TED: The Economics Daily, October 2, 2019.
[ix] Kim Weeden, “Occupational Segregation,” Pathways: A Magazine on Poverty, Inequality, and Social Policy (Special Issue 2019): 33–36.
[x] Economic Policy Institute Current Population Survey Extracts, Version 1.0.15 (2021).
[xi] Bureau of Labor Statistics, “Table 2. Median Weekly Earnings of Full-Time Wage and Salary Workers by Union Affiliation and Selected Characteristics” (economic news release), January 22, 2021.
[xii] Allison Scott, Freada Kapor Klein, and Uriridiakoghene Onovakpuri, Tech Leavers Study, Kapor Center for Social Impact, April 2017.
[xiii] Bureau of Labor Statistics, “Table 3. Union Affiliation of Employed Wage and Salary Workers by Occupation and Industry” (economic news release), January 22, 2021.
[xiv] Department for Professional Employees, AFL-CIO, Toolkit: Advancing Racial Justice in the Professional Workplace, July 2020.
[xv] Celine McNicholas, Margaret Poydock, and Lynn Rhinehart, Why Workers Need the Protecting the Right to Organize Act (fact sheet), Economic Policy Institute, February 2021.
[xvi] Celine McNicholas, “The Restoring Justice for Workers Act Is a Crucial First Step Toward Shifting the Balance of Power Between Workers and Employers” (statement), Economic Policy Institute, May 15, 2019.
[xvii] Alexander J.S. Colvin, The Growing Use of Mandatory Arbitration, Economic Policy Institute, April 2018.
[xviii] Candice Norwood, “A Yearslong Push to Ban Hair Discrimination Is Gaining Momentum,” PBS NewsHour, March 30, 2021.
[xix] Valerie Wilson and William M. Rodgers III, Black-White Wage Gaps Expand with Rising Wage Inequality, Economic Policy Institute, September 2016.
[xx] AAUW, “State and Local Salary History Bans” (interactive map), accessed June 3, 2021.
[xxi] Daniel Costa and Ron Hira, H-1B Visas and Prevailing Wage Levels: A Majority of H-1B Employers—Including Major U.S. Tech Firms—Use the Program to Pay Migrant Workers Well Below Market Wages, Economic Policy Institute, May 2020. See also U.S. Citizenship and Immigration Services, U.S. Department of Homeland Security, Modification of Registration Requirement for Petitioners Seeking to File Cap-Subject H-1B Petitions, 86 Fed. Reg. 1676, at Table 7, page 1720, showing that 85% of new H-1B petitions went to employers paying at wage level 1 or 2, and 90% of petitions for the advanced degree exemption were awarded to employers paying at wage levels 1 and 2. Both wage levels 1 and 2 are below the local median wage for the specific occupation.
[xxii] Employment and Training Administration, U.S. Department of Labor, Strengthening Wage Protections for the Temporary and Permanent Employment of Certain Aliens in the United States, Final Rule, 86 Fed. Reg. 3608, January 14, 2021.
[xxiii] Daniel Costa, H-1B Visa Needs Reform to Make It Fairer to Migrant and American Workers (fact sheet), Economic Policy Institute, April 5, 2017.
[xxiv] Department for Professional Employees, AFL-CIO, The H-1B Temporary Visa Program’s Impact on Diversity in STEM (fact sheet), March 2020.
[xxv] Department for Professional Employees, AFL-CIO, A Policy Agenda for Advancing Diversity, Equity, and Inclusion (DEI) in the Arts, Entertainment, and Media Industries, February 2021.
Guest Worker Visas: The H-1B and L-1
2021 FACT SHEET
The H-1B and L-1 guest worker programs play an important role in our economy by attracting skilled talent to the United States. Unfortunately, these programs are not living up to their original intent, and instead have become tools for many employers to lower labor costs by replacing U.S. professionals with workers who can be paid below-market wages in employment arrangements where the employer controls their ability to live and work in the United States. These programs must be reformed so that they work for U.S. professionals and the people employed on H-1B and L-1 visas.[i]
This fact sheet explains the H-1B and L-1 guest worker programs, explores the current usage of these programs, and discusses the consequences of the programs for professionals.
What are Guest Worker Visas?
Guest worker or “non-immigrant” visas, including the H-1B and L-1, allow U.S. employers to hire citizens of foreign countries to temporarily work in the United States.[ii]
The H-1B Visa: Eligibility, Use, and Regulation
The H-1B visa is a non-immigrant visa that allows an employer to hire guest workers who will be employed temporarily in “specialty occupations,” which are occupations that typically require at least a bachelor’s degree or equivalent.[iii] The visa is held by the employer (also known as the petitioner), not the worker (also referred to as the beneficiary).[iv] H-1B beneficiaries must either have a bachelor’s degree or higher, have a state license or certification that permits practice in the specialty occupation, or have training or experience in the specialty occupation that is equivalent to completion of a degree.[v] While employers use the H-1B visa to hire workers in a variety of occupations, most visas go to employers hiring workers in computer-related occupations (66.1 percent in FY 2019).[vi]
The H-1B visa is typically issued for an initial term of three years and can be renewed for another three years. If the petitioning employer sponsors the worker for permanent status, then the H-1B visa can be extended in one-year increments while the worker waits for an available immigrant visa. While beneficiaries must leave the United States upon the expiration of their visas, those who spend at least one year outside of the U.S. may be eligible to return under a new H-1B visa. However, employers involved in Department of Defense (DOD) cooperative research and development projects or co-production projects can petition for H-1B visas that are valid for five years and able to be renewed so the beneficiary can stay in the United States for up to 10 years.[vii]
There is an annual cap of 65,000 on the number of initial H-1B visas. However, there are several exceptions, which together raised the total number of initial visas issued to 148,374 in fiscal year 2019.[viii] The exceptions include 20,000 additional visas available every year for beneficiaries holding a master’s degree or higher from an American institution of higher education and an unlimited number of visas available for nonprofit and governmental organizations that conduct research and for colleges and universities. In addition, the annual cap does not apply to petitions for renewals, changes to the conditions of an H-1B beneficiary’s employment, or requests for new employment for an H-1B beneficiary already in the United States.[ix]
Employers who petition for H-1B visas are generally not required to first recruit qualified U.S. workers for available positions, nor are they prohibited from displacing existing U.S. workers in favor of lower-paid guest workers.[x] H-1B employers must only attest: (1) “that they will pay H-1B workers the amount they pay other employees with similar experience and qualifications or the prevailing wage; (2) that the employment of H-1B workers will not adversely affect the working conditions of U.S. workers similarly employed; (3) that no strike or lockout exists in the occupational classification at the place of employment; and (4) that the employer has notified employees at the place of employment of the intent to employ H-1B workers.”[xi]
The L-1 Visa
The L-1 visa is used by multinational corporations to transfer employees employed abroad to a branch, parent, affiliate, or subsidiary of that same employer in the United States. The petitioning company must have employed the L-1 beneficiary within the three preceding years and have continuously employed the beneficiary abroad for one year.[xii] There are two classes, the L-1A visa is for managers and executives and the L-1B visa is for employees with “specialized knowledge.”[xiii] The L-2 visa is also available to grant employment authorization for dependents of L-1 workers.
As with the H-1B visa, the L-1 visa is held by the employer, not the worker.[xiv] The L-1 visa program is uncapped. For employees entering the United States to establish a new office, the initial term of the L-1 visa is one year, while L-1 visas covering all other employees have initial terms of three years. The L-1 visa is renewable for up to seven years total for supervisors[xv] and five years for other qualified employees.[xvi]
B-1 in Lieu of H-1B
The B-1 visa in lieu of H-1B (temporary visitors for business) allows employers to bring people otherwise eligible for the H-1B progran from abroad to the United States even when the cap for H-1B workers has been reached. Beneficiaries of the B-1 in lieu of H must have a bachelor’s degree, perform work or receive training of an H-1B caliber (specialty work), be paid by their foreign employer (cannot be a U.S. source), and the task they are coming to America to do can be accomplished in a short amount of time.[xvii] There is no information available on how many of these visas are issued each year, their duration of stay, the type of work involved, or the requesting/sponsoring employer.
In late 2011, the Boeing Company attempted to bring 18 Russian contractors from its engineering and design center in Moscow on B-1 visas in lieu of H-1B. The Russian contractors were denied entry at Sea-Tac Airport by immigration officials after the contractors admitted that they would be working at Boeing in Seattle as opposed to receiving training. The Russian engineers told investigators that they were coached by their Russian employer to tell immigration officials that they would be receiving training and not working. The union representing engineers at Boeing reported that Boeing had between 75 and 200 Russian engineers working at Boeing in Seattle at any one time on B-1 in lieu of H-1B visas. If the Russian engineers had been on H-1B visas, then Boeing would have to pay them wages set forth in the collective bargaining agreement. Instead, the Russian engineers were paid wages that were one-third to one-fifth of what the U.S. Boeing engineers made.[xviii]
Quantifying the High-Skilled Guest Worker Workforce
H-1B and L-1 workers are highly concentrated in STEM occupations. In fiscal year 2019, over 80 percent of H-1B petitions were for beneficiaries employed in STEM occupations, with 66 percent of petitions for computer-related occupations alone.[xix] While the vast majority of L-1A visa beneficiaries work in management occupations due to the nature of the visa, four out of the five top industries for employers applying for initial or continuing L-1A visas in FY 2019 were in computer or engineering related occupations, with these four industries accounting for 48.4 percent of L-1A visas alone. Of the applications with a known occupation listed, 63 percent of all initial or continuing L-1B visas issued in FY 2019 were for STEM occupations.[xx]
Overall, in 2019, there were 1,681,963 non-U.S. citizens employed (7.8 percent) in STEM occupations (business and financial operations, computer and mathematical science, architecture and engineering, and life, physical, and social science occupations) and over four million non-U.S. citizens employed in all professional occupations (5.5 percent of the professional workforce).[xxi]
H-1B Visa Workforce
The U.S. government does not track how many H-1B workers are in the United States at any given time. USCIS only releases the number of initial and renewed visas that are issued each year, which makes it difficult to quantify the size and impact of the H-1B program on the labor market. The Economic Policy Institute (EPI) estimates there were 583,420 people working on H-1B visas in the United States in 2019, an increase of more than 50,000 from the estimate for 2016.[xxii] This mirrors the long-term increase in employer reliance on the H-1B program.

L-1 Visa Workforce
The L-1 visa is largely a black box. There is no data available showing how much L-1 workers are paid or the duration of their stays. In FY 2019, USCIS approved approximately 30,000 L-1 visa petitions filed by 12,000 employers.[xxiii] It is unknown precisely how many are working in the country at any given time, but EPI estimates that companies employed 337,164 L-1 workers in 2019.[xxiv]
Limited Regulations Promote Misuse
Low Pay and Minimal Protections
The H-1B and L-1 visa programs provide no real protections for guest workers or U.S. workers. The programs’ wage standards are so low (or non-existent) that it is easy for employers to replace existing U.S. workers with guest workers, saving employers hundreds of thousands of dollars.[xxv]
While wage standards do exist for the H-1B visa, they are so low that there is still a significant cost incentive for employers to displace U.S. professionals. The program’s prevailing wage standard is set by three factors: occupation, location, and skill level. For an H-1B beneficiary, in a given job and in a given location, the employer can pay one of four levels based in part on the job requirements, which is determined by the employer. Analysis from EPI and Howard University Professor Ron Hira shows that 60 percent of H-1B positions were paid at the lowest two levels in fiscal year 2019, below the median wage for the given occupation and location. All types of companies, including big-name tech firms, take advantage of these low wage requirements. For example, Amazon and Microsoft each had three-fourths or more of their H-1B positions assigned as Level 1 or Level 2 and Google had over one-half assigned as Level 2.[xxvi]
|
Certified Wage Levels of H-1B Positions, Fiscal Years 2017 - 2019 |
|||||
|
Wage level |
Percentile of surveyed wages by occupation & region |
Description of wage level |
FY 2017 |
FY 2018 |
FY 2019 |
|
1 |
17th |
Entry-level |
32% |
16% |
14% |
|
2 |
34th |
Qualified |
30% |
47% |
46% |
|
3 |
50th |
Experienced |
11% |
19% |
19% |
|
4 |
67th |
Fully competent |
6% |
10% |
12% |
|
Other |
N/A |
Other wage surveys, including privately financed surveys |
21% |
8% |
9% |
[xxvii]
From an employer’s perspective, L-1 visas are desirable, because there are no minimum wage requirements, allowing employers to legally pay well below the market wage, offshore work, and displace U.S. workers. Employers only face consequences when they are caught failing to meet the lowest of labor standards. For example, in late 2013, a Fremont, California, tech company, Electronics for Imaging, was fined by the U.S. Department of Labor (DOL) and ordered to pay back wages to guest workers who were paid just $1.21 per hour to install computer systems. The employees were likely on L-1 visas. Since there is no prevailing wage requirement, Electronics for Imaging was only required to pay its foreign employees the state minimum wage (note: since there is no prevailing wage L-1 employers have to pay the higher of the state or federal minimum wage, consistent with standard employment law).[xxviii]
Another factor that enables H-1B employers to take advantage of guest workers is that the H-1B beneficiaries can lose their legal status and be forced to return to their home country if they are terminated by their employer. The GAO noted that “[a]ccording to agency officials, H-1B workers are likely to be reluctant to file complaints against employers for fear that the company might be disbarred, which in turn could result in the complainant and fellow H-1B workers at the company losing their jobs and potentially having to leave the United States.” The H-1B workers are also reluctant to cooperate after a complaint has been filed “for fear of similar repercussions.”
DOL has cited numerous obstacles to its ability to protect H-1B workers, including lack of authority to initiate investigations, inability to access the Labor Condition Application database, inadequate fines for employer noncompliance with a DOL investigation, and lack of subpoena authority to obtain employer records.
Offshoring and Displacement
Offshore outsourcing is a term used to describe the practice of a U.S. company contracting with a foreign corporation to move in-house professional and technical jobs to a lower-cost foreign country. H-1B and L-1 visas are used to facilitate the movement of U.S. jobs offshore.
Nearly 40 percent of all H-1B visas are issued to just 30 employers, 17 of which are companies where the primary business model is based on outsourcing. These firms alone were issued 20,000 H-1B visas, nearly one-quarter of the total 85,000 annual limit for cap-subject visas.[xxix]
While there are many stories of employers using the H-1B program to displace existing workers, one of the most recent egregious examples of H-1B abuse was carried out by a public university. In February 2017, the University of California, San Francisco (UCSF) laid off 79 IT professionals and replaced them with H-1B workers who work for the Indian outsourcing company HCL Technologies. And to add further insult to injury, the UCSF employees were required to train their replacements before they were laid off.[xxx]
High profile cases at Disney, Southern California Edison and AT&T further illustrate the misuse of the H-1B visa program. In 2015, the Walt Disney Company laid off an estimated 250 IT professionals at Disney World, many of whom were subsequently replaced by H-1B beneficiaries hired through an outsourcing company. Some of the laid off employees were even required to train their replacements in order to be eligible for severance payments. [xxxi] These high-profile layoffs were part of a pattern of outsourcing at different Disney corporate divisions. However, public scrutiny in the wake of the Disney World layoffs led the company to reverse course with one planned layoff of approximately 35 IT professionals at Disney / ABC television in New York City and Burbank, California.[xxxii]
Between 2014 and 2015 Southern California Edison (SCE), a highly profitable utility company, said it would shed 500 of its information technology professionals and replace them with H-1B workers, with some of the work going offshore. Before the SCE professionals were laid off they were required to train their guest worker replacements and sign a non-disparagement agreement in order to receive their severance packages. SCE essentially said it was contracting with India-based Infosys and Tata Consultancy Services because other companies are adopting the same business strategy.[xxxiii]
In 2019, telecommunications giant AT&T announced a series of agreements with outsourcing companies Accenture, IBM, and Tech Mahindra, which are some of the most prodigious users of the H-1B visa. Just one of these contracts resulted in the transfer of an estimated 3,000 jobs to Accenture. However, after these professionals were “rebadged” as Accenture employees, many were instructed to train their guest worker replacements. As one impacted worker said after being transferred to an outsourcing company, “You’re at the mercy of a company that doesn’t really want you.”[xxxiv]
The L-1 visa is also often used by companies to facilitate “knowledge transfer.” This means employers have guest workers come to the United States to learn new skills and then the employer has the guest worker take the knowledge and skills they’ve learned back to their home country. For example, Intel uses the L-1 visa so American workers can “train L-1 workers who staff the company’s offices in Russia, India, China and other high-growth markets.”[xxxv]
Policy Recommendations
The United States should adopt policies that protect and promote the investment our country has made in its skilled workforce and ensure that opportunities are available for the young adults we have urged to enter STEM professions. DPE recommends the following five reforms be made to the high-skilled guest worker visa programs:
Require employers to advertise the job to U.S. workers and offer the job to a qualified U.S. applicant before seeking a nonimmigrant through the H-1B or L-1 programs.
Prohibit contractors and direct employers from laying off, terminating, or demoting a U.S. worker in order to replace that worker with a nonimmigrant.
Increase the wage floor for the H-1B program to no less than the median wage for the relevant occupation and area and establish minimum wage standards for the L-1 program. This would also create an incentive for employers to invest in training U.S. workers and better ensure that guest workers earn a fair a return on their work.
Ensure nonimmigrants and U.S. workers are able to report workplace violations without fear of retaliation and conduct regular audits to ensure employer compliance with visa program rules.
Allow H-1B and L-1 nonimmigrants to self-petition for permanent status and have the freedom to change jobs while waiting for available immigrant visas.
April 2021
[i] Costa, Daniel. “H-1B visa needs reform to make it fairer to migrant and American workers.” (April 2017). Economic Policy Institute. Retrieved from https://www.epi.org/publication/h-1b-visa-needs-reform-to-make-it-fairer-to-migrant-and-american-workers
[ii] U.S. Customs and Border Protection. “What is the difference between an Immigrant Visa vs. Nonimmigrant Visa ?” (September 2019). Retrieved from https://help.cbp.gov/s/article/Article-72
[iii] Regulations outline this requirement in four ways. 1. “A bachelor’s or higher degree or its equivalent is normally the minimum entry requirement for the position.” 2.“The degree requirement is common to the industry in parallel positions among similar organizations or, in the alternative, the position is so complex or unique that it can be performed only by an individual with a degree.” 3. “The employer normally requires a degree or its equivalent for the position.” 4. “The nature of the specific duties is so specialized and complex that the knowledge required to perform the duties is usually associated with attainment of a bachelor’s or higher degree.” See U.S. Citizenship and Immigration Services. “Characteristics of H-1B Specialty Occupation Workers: Fiscal Year 2019 Annual Report to Congress.” (March 2020). Retrieved from https://www.uscis.gov/sites/default/files/document/reports/Characteristics_of_Specialty_Occupation_Workers_H-1B_Fiscal_Year_2019.pdf
[iv] 8 CFR §214.2(h)
[v] Ibid.
[vi] Ibid.
[vii] Ibid.
[viii] Ibid.
[ix] Ibid.
[x] Based on their usage of the H-1B program, the Department of Labor may determine that certain employers are H-1B “dependent employers.” “Dependent employers” and other employers deemed “willful violators” must attest that (1) “The employer has not displaced a U.S. worker at the time of filing an H-1B visa petition;”, (2) "Before placing an H-1B worker at a secondary employer’s work site, the employer has inquired as to the secondary employer’s intent to displace a U.S. worker;” (3) “The employer has taken good faith steps to recruit U.S. workers;” and (4) “The employer has offered the job to any equally or better qualified U.S. worker who applies for the job for which the H-1B worker is sought.” Employers are exempt from these requirements for H-1B workers who receive annual wages equal to or higher than $60,000, or have attained a master’s or higher degree in a specialty related to their employment.
See U.S. Department of Labor. “Fact Sheet #62C: Who is an H-1B-dependent employer?” (July 2008). Retrieved from https://www.dol.gov/sites/dolgov/files/WHD/legacy/files/whdfs62C.pdf and U.S. Department of Labor. “Fact Sheet #62S: What is a willful violator employer?” (July 2008). Retrieved from https://www.dol.gov/sites/dolgov/files/WHD/legacy/files/whdfs62S.pdf.
[xi] Government Accountability Office. “H-1B Program: Reforms Needed to minimize the Risks and Costs of Current Program.” (January 2011). Retrieved from https://www.gao.gov/assets/gao-11-26.pdf
[xii] Costa, Daniel. “Abuses in the L-Visa Program: Undermining the U.S. Labor Market.” Economic Policy Institute. (August 2010). Retrieved from https://www.epi.org/publication/abuses_in_the_l-visa_program_undermining_the_us_labor_market/
[xiii] 8 CFR § 214.2(l)
[xiv] U.S. Citizenship and Immigration Services. “L-1A Intracompany Transferee Executive or Manager.” (February 2021). Retrieved from https://www.uscis.gov/working-in-the-united-states/temporary-workers/l-1a-intracompany-transferee-executive-or-manager
[xv] Ibid.
[xvi] U.S. Citizenship and Immigration Services. “L-1B Intracompany Transferee Specialized Knowledge.” (May 2020). Retrieved from https://www.uscis.gov/working-in-the-united-states/temporary-workers/l-1b-intracompany-transferee-specialized-knowledge.
[xvii] 9 FAM 41.31 N11
[xviii] Gates, Dominic. “Russian engineers, once turned back, now flowing to Boeing again.” (April 2012). The Seattle Times. Retrieved from https://www.seattletimes.com/business/russian-engineers-once-turned-back-now-flowing-to-boeing-again/
[xix] “FY 2019 Characteristics of H-1B Specialty Occupation Workers.”
[xx] U.S. Citizenship and Immigration Services. “Summary of Approved L-1 Petitions by Employers.” (February 2020). Retrieved from https://www.uscis.gov/sites/default/files/document/reports/1-L1Report_Report_02-26-20_DO_cleared.pdf
[xxi] U.S. Census Bureau. American Community Survey Microdata. (2019). Retrieved from https://data.census.gov/mdat
[xxii] “Temporary work visa programs and the need for reform.”
[xxiii] “Summary of Approved L-1 Petitions by Employers.”
[xxiv] “Temporary work visa programs and the need for reform.”
[xxv] Hira, Ron. “New Data Show How Firms Like Infosys and Tata Abuse the H-1B Program.” (February 2015). Economic Policy Institute. Retrieved from https://www.epi.org/blog/new-data-infosys-tata-abuse-h-1b-program/
[xxvi] Costa, Daniel and Hira, Ron. “H-1B visas and prevailing wage levels.” (May 2020). Economic Policy Institute. Retrieved from https://www.epi.org/publication/h-1b-visas-and-prevailing-wage-levels/
[xxvii] Ibid.
[xxviii] Costa, Daniel. “Little-known temporary visas for foreign tech workers depress wages.” (November 2014). The Hill. Retrieved from https://thehill.com/blogs/pundits-blog/technology/223607-little-known-temporary-visas-for-foreign-tech-workers-depress.
[xxix] Hira, Ron and Costa, Daniel. “The H-1B visa program remains the ‘outsourcing visa.’” (March 2021). Economic Policy Institute. Retrieved from https://www.epi.org/blog/the-h-1b-visa-program-remains-the-outsourcing-visa-more-than-half-of-the-top-30-h-1b-employers-were-outsourcing-firms/
[xxx] Hanson, Louis. “After pink slips, UCSF workers train their foreign replacements.” (November 2016). The Mercury News. Retrieved from https://www.mercurynews.com/2016/11/03/after-pink-slips-ucsf-tech-workers-train-their-foreign-replacements/
[xxxi] Preston, Julia. “Pink Slips at Disney. But First, Training Foreign Replacements.” (June 2015). New York Times. Retrieved from https://www.nytimes.com/2015/06/04/us/last-task-after-layoff-at-disney-train-foreign-replacements.html
[xxxii] Thibodeau, Patrick. “In a turnabout, Disney ABC TV cancels plans to outsource IT jobs.” (June 2015). ComputerWorld. Retrieved from https://www.computerworld.com/article/2934978/in-a-turnabout-disney-abc-tv-cancels-plans-to-outsource-it-jobs.html.
[xxxiii] Thibodeau, Patrick. “Southern California Edison IT workers ‘beyond furious’ over H-1B replacements.” (February 2015). ComputerWorld. Retrieved from https://www.computerworld.com/article/2879083/southern-california-edison-it-workers-beyond-furious-over-h-1b-replacements.html
[xxxiv] Kight, Stef. “U.S. companies are forcing workers to train their own foreign replacements.” (December 2019). Axios. Retrieved from https://www.axios.com/trump-att-outsourcing-h1b-visa-foreign-workers-1f26cd20-664a-4b5f-a2e3-361c8d2af502.html
[xxxv] “Ultimate job-loss insult: training your own replacement.” (August 2003). USA Today.
Use and Abuse of the J-1 Exchange Visitor Teacher Program
2021 FACT SHEET
Public and private schools use the J-1 exchange visitor teacher program, one of several categories of the J-1 visa program, to employ teachers from abroad in the United States. Despite facilitating employment, the J-1 visa program lacks the appropriate safeguards to prevent workplace abuse, harming J-1 teachers and U.S. educators alike.
Few Regulations Govern the J-1 Exchange Visitor Teacher Program
While employment is a core component of the visa, the U.S. Department of Labor has no formal oversight role. The U.S. Department of State, which oversees the program that Congress intended for educational and cultural exchange,[1] provides very little oversight over the recruitment practices and working conditions faced by J-1 teachers.[2]
Typically, teachers in other countries learn about the J-1 teacher program and apply to work in the United States through unregulated labor recruitment agencies. Unlike guest worker programs governed by Department of Labor regulations, agencies recruiting for the J-1 teacher program are allowed to charge recruitment fees and other expenses, which can total upwards of $15,000.[3] J-1 teachers typically cannot pay this total upfront, leaving them saddled with high-interest debt owed to their recruiters before they even arrive in the United States and start teaching.[4]
Lacking even the bare minimum protections of guestworker visa programs, school systems that employ J-1 teachers do not need to seek any type of pre-approval or labor certification from the U.S. Department of Labor. There are no requirements governing how much school systems must pay J-1 teachers, and no limit on the number of teachers recruited through the program. Employers who hire J-1 visa program participants are, in most cases, not required to pay federal FICA taxes (7.65%), providing a strong financial incentive for schools to skip past available, qualified U.S. educators.[5]
Quantifying the J-1 Exchange Visitor Teacher Program
The U.S. Department of State does not release substantive data about who is employed through the J-1 teacher program and in what types of schools. Based on the limited data available, it is clear that K-12 school systems are increasing their use of the J-1 teacher program to recruit teachers.[7] However, we do not know the ages, genders, or countries of origin of J-1 teachers nor the specific public or private schools that employ them. Additionally, the U.S. Department of State does not publish salary data for program participants. The lack of detailed program data makes it difficult to understand the degree to which specific school districts are relying on the J-1 teacher program and its impact on the overall labor market conditions for educators.
|
States with the largest number of J-1 Teachers, 2016-2019 [6] |
|
|
State |
Participants |
|
NC |
2,027 |
|
SC |
1,224 |
|
CA |
1,159 |
|
TX |
1,103 |
|
AZ |
794 |
|
FL |
662 |
|
NM |
604 |
|
LA |
405 |
|
UT |
389 |
|
NY |
333 |

The J-1 Visa and Workplace Rights
In contrast with comparable temporary work visa programs, the J-1 teacher program has no specific wage regulations other than the requirement that positions must “comply with any applicable collective bargaining agreement.”[8] Therefore, absent a union contract, employers may elect to pay J-1 teachers significantly less than they pay other teachers working in the same school.
Teachers hired on J-1 visas have the right to become members of and fully participate in their unions, and are protected by applicable labor law. J-1 teachers working in public schools are protected by state public sector labor law, while those working in private or charter schools are fully protected by the National Labor Relations Act, including having the right to participate in efforts to organize new unions at their workplaces. Additionally, J-1 visa program regulations are clear that program sponsors and employers are not allowed to retaliate against J-1 visa program participants for consulting with advocacy, community, and legal organizations, filing complaints against sponsors and employers, testifying in proceedings, or exercising any other right afforded to them under the law.[9] Despite these legal rights, some J-1 teachers may feel unable to participate fully in their unions because of the close relationship between many school administrators and recruitment agencies, which can lead to intimidation and fear of deportation.[10] In addition, while J-1 teachers are fully within their legal rights to participate in work stoppages and other concerted activities, certain visa rules could create uncertainty for these teachers about possible retaliation from sponsor organizations or their employers.[11] The lack of government oversight of recruitment and labor practices in the program is a strong factor in creating an environment rife with intimidation as few formal pathways exist for these educators to report abuses without fear of retaliation.[12]
A Case Study of Exploitation in New Mexico
The lack of regulatory structures has left J-1teachers vulnerable to abuse.
In January 2021, the New Mexico Attorney General sued a recruitment agency, Total Teaching Solutions International (TTSI), for charging teachers excessive recruitment fees and making misleading statements about the agency’s ability to help teachers obtain J-1 visas. According to the lawsuit, the recruitment agency threatened teachers with lawsuits and deportation if they did not pay their hefty monthly recruitment fees.[13] Furthermore, there are signs of direct collaboration between TTSI and at least one employing school district - the CEO of TTSI is married to the superintendent of the school district in the town of Ruidoso. The lawsuit alleges that TTSI used its association with the superintendent of Ruidoso schools to boost its legitimacy and build connections with other New Mexico School Districts. Furthermore, the superintendent is alleged to have played an active role in attempting to collect recruitment fees from J-1 teacher program participants.[14]
The Attorney General’s lawsuit was filed after TTSI filed lawsuits against several J-1 teachers and served them at their schools for allegedly failing to keep up with their exorbitant monthly payments to the agency. These teachers, with the help of their union, the American Federation of Teachers, successfully defeated these lawsuits and raised awareness of the exploitative conditions faced by J-1 teachers.[15]
But the lawsuit in New Mexico is just the latest high-profile case of recruitment agencies overcharging J-1 teachers. Until there is substantial change in the structure and regulations governing the J-1 teacher program, recruitment agencies will continue to charge steep recruitment fees that trap J-1 teachers in a cycle of debt.
Reforms Are Needed
Significant regulatory changes are necessary to address widespread problems in the larger J-1 visa program and the exchange visitor teacher program specifically. These reforms must start with the recognition that the J-1 visa program is an employment visa, not solely a cultural exchange program. The U.S. Department of State therefore needs to formalize a partnership with the U.S. Department of Labor to implement the following recommendations. This list is not exhaustive of the necessary changes but addresses the J-1 visa program’s most pressing problems.
1. Broad and effective oversight is needed to guarantee that teachers working on J-1 visas have robust labor and employment protections, including wage regulations to ensure J-1 teachers are paid no less than their colleagues doing the same work.
2. Recruitment practices must be regulated to prohibit recruiters and sponsors from charging recruitment fees to J-1 teachers and hold recruiters and employers jointly liable when they benefit from abusive recruitment practices, including deceptive promises made during recruitment.
3. Teachers hired through the J-1 visa program must be informed of their legal rights and have effective mechanisms for legal recourse when their rights are violated. J-1 teachers who assert labor and employment or civil rights claims or who are critical to the effective investigation and litigation of such proceedings must have their visas extended, be granted deferred action or other affirmative relief, or be provided with support to apply for U or T visas. Additionally, existing regulations that prohibit employer and sponsor retaliation against J-1 visa program participants who engage in protected activity or assert their rights under local, state, or federal laws must be strengthened and fully enforced. Finally, the regulations that permit program sponsors to suspend J-1 program participants if they “fail to pursue the activities for which he or she was admitted to the United States,” must be clarified to explicitly state that J-1 visa program participants have the right to strike and engage in other concerted activity protected under U.S. labor law.
4. The U.S. Department of State must increase transparency within the J-1 visa program by making information about visa sponsors and beneficiaries publicly available and easily accessible to the public. This includes sponsorship, recruiter, and employer contracts and fees, occupations, wages, employers, job sites, and demographic data.
Though the J-1 teacher program is administered by the federal government, state and local policymakers also have a role to play since public school systems employ a significant portion of J-1 teachers. The Code for the Ethical International Recruitment and Employment of Teachers, developed by education administrators, labor leaders, and academics, provides a template for how Department of States of education and school districts can engage with the J-1 teacher program responsibly and ensure they do not replicate abusive recruitment practices in their role as employers.[16]
March 2021
[1] The J-1 exchange visitor program was created in 1961 by the Fulbright–Hays Act in order “to increase mutual understanding between the people of the United States and the people of other countries by means of educational and cultural exchange.” Mutual Educational and Cultural Exchange Act of 1961. 22 USC §2451.
[2] While this factsheet is focused on the experiences of teachers working under the J-1 visa, extensive research has been conducted about the grueling working conditions often faced by those working under the summer work travel and au pair programs. See https://migrationthatworks.files.wordpress.com/2020/01/shining-a-light-on-summer-work.pdf and https://www.epi.org/blog/au-pair-lawsuit-reveals-collusion-and-large-scale-wage-theft-from-migrant-women-through-state-departments-j-1-visa-program/.
[3] Villagran, Lauren. “Foreign teachers are paying to work in New Mexico public schools. Here's why.” Farmington Daily Times. October 29, 2018. Available at https://www.daily-times.com/story/news/education/2018/10/16/foreign-teachers-pay-j-1-visas-nm-school-districts/1618327002/.
[4] “Visa Pages: U.S. Temporary Foreign Worker Visas.” Justice in Motion. January 2020. Available at https://www.justiceinmotion.org/j1.
[5] Ibid.; https://www.irs.gov/individuals/international-taxpayers/aliens-employed-in-the-us-social-security-taxes
[6] “Facts and Figures: BridgeUSA J-1 Visa Basics.” U.S. Department of State. Retrieved from https://j1visa.state.gov/basics/facts-and-figures/
[7] Ibid.
[8] 22 CFR Section 62.24(f).
[9] 22 CFR Section 62.10(d) states that: “No sponsor or employee of a sponsor may threaten program termination, remove from the program, ban from the program, adversely annotate an exchange visitor's SEVIS record, or otherwise retaliate against an exchange visitor solely because he/she has filed a complaint; instituted or caused to be instituted any proceeding; testified or is about to testify; consulted with an advocacy organization, community organization, legal assistance program or attorney about a grievance or other work-related legal matter; or exercised or asserted on behalf of himself/herself any right or protection.”
[10] Mabe, Rachel. “Trafficking in Teachers.” Oxford American. August 25, 2020. Retrieved from https://www.oxfordamerican.org/magazine/item/1963-trafficking-in-teachers.
[11] 22 CFR Section 62.40 states that a J-1 visa program sponsor is supposed to terminate an exchange visitor’s participation in the program if they “fail to pursue the activities for which he or she was admitted to the United States.”
[12] Costa, Daniel. “Guestworker diplomacy: J visas receive minimal oversight despite significant implications for the U.S. labor market.” Economic Policy Institute. July 14, 2011. Retrieved from https://www.epi.org/publication/j_visas_minimal_oversight_despite_significant_implications_for_the_labor_ma/.
[13] Carillo, Edmundo. “Suit: New Mexico firm cheats Philippine teachers.” Albuquerque Journal. January 5, 2021. Retrieved from https://www.abqjournal.com/1533005/lawsuit-nm-company-taking-advantage-of-filipino-teachers.html.
[14] 2nd Judicial District Court of New Mexico. State of New Mexico v. Total Teaching Solutions International, Inc. Complaint. Retrieved from https://www.nmag.gov/uploads/PressRelease/48737699ae174b30ac51a7eb286e661f/Attorney_General_Balderas_Files_Lawsuit_Against_Total_Teaching_Solutions_Inc..pdf
[15] “AFT fights exploitation of teachers from the Philippines.” American Federation of Teachers. January 27, 2021. Retrieved from https://www.aft.org/news/aft-fights-exploitation-teachers-philippines.
[16] Code for the Ethical International Recruitment and Employment of Teachers. Alliance for Ethical International Recruitment Practices. Retrieved from https://www.aft.org/sites/default/files/code_intl_recruitment_2017.pdf
The H-1B Temporary Visa Program's Impact on Diversity in STEM
2020 Fact Sheet
The current H-1B visa program limits career opportunities for women, African Americans, and Latinos.
Women, African Americans, and Latinos are not equitably represented in science, technology, engineering and math (STEM) occupations.[1] Especially in computer-related occupations, employers’ use of the H-1B visa program to hire temporary foreign workers at below-market wages contributes significantly to this under-representation.
Federal law does not require most employers to recruit available, qualified U.S. professionals before hiring temporary foreign workers through the H-1B visa program.[2] The law also allows employers to pay H-1B workers below market wages, which is why the majority of H-1B guest workers are paid 20-40 percent less than the median wage for professionals in the same occupation and geographic area.[3] Because employers control the visa and it is difficult for H-1B workers to change jobs, the workers are susceptible to exploitation and retaliation for exercising their workplace rights.
The H-1B visa program must be reformed so that it works for U.S. professionals and people working on H-1B visas. Until then, women, African Americans and Latinos will continue to be underrepresented in the STEM occupations where H-1B usage is highest.[4]
Employer H-1B Use Hurts Diversity in STEM Occupations
Typically, 70 percent of all new H-1B visas go to employers hiring foreign temporary workers in STEM occupations. In particular, employers use the H-1B visa program to hire computer professionals. Between FY 2012 and FY 2018, U.S. Citizenship and Immigration Services (USCIS) approved 497,467 initial H-1B petitions for computer-related occupations; 78,139 initial H-1B petitions for architecture, engineering and surveying occupations; and 34,902 initial H-1B petitions for math, life science and physical science occupations.[5]
As employers have utilized the H-1B visa program to make hires in computer occupations, women, African Americans and Latinos have made slower progress towards equitable representation. In STEM fields that utilize fewer H-1B visas, women, African Americans, and Latinos are making faster gains.
|
Change in representation percentage, private-sector STEM occupations, 2013 – 2019 |
|||
|
Women |
African Americans |
Latinos |
|
|
Computer occupations |
0.79% |
0.53% |
1.27% |
|
Other STEM occupations |
2.40% |
0.81% |
2.23% |
Gender Representation in the STEM Workforce
Women are underrepresented in STEM occupations, especially in computer occupations and architecture and engineering occupations, where in 2019 they made up just 25 percent and 15 percent of the workforce, respectively.[7] Women are the majority of Americans employed in private-sector, non-STEM professional occupations.[8]
Women actually made up a larger share of the computer workforce twenty years ago than they do today.[9] The increased use of the H-1B program will effectively make it impossible for women to achieve parity. The program exacerbates the gender imbalance in part because nearly 75 percent of all H-1B petitions for initial and continuing employment are for male beneficiaries.[10] Thus, women will continue to struggle for access to some of the most in-demand, lucrative STEM careers.
|
Share of new private-sector positions going to men and women, 2013 - 2019 |
||
|
Occupation |
Men |
Women |
|
Computer occupations |
73% |
27% |
|
Math occupations |
51% |
49% |
|
Architecture and engineering occupations |
74% |
26% |
|
Physical and life science occupations |
42% |
58% |
|
All STEM occupations |
70% |
30% |
|
Other professional occupations |
23% |
77% |
|
All occupations |
52% |
48% |
The hiring of women in computer occupations is so low that at its current pace of change it would take more than 190 years for women to achieve equitable representation in computer occupations and over 105 years to achieve the same in architecture and engineering occupations.[12]
Racial and Ethnic Representation in the STEM Workforce
The hiring of Black and Latino professionals in STEM fields, especially computer occupations, trails hiring in other professional fields and across all occupations. While there has been a moderate increase in representation for Black and Latino STEM professionals since 2013, the rate of change has been slowing. From 2013 – 2019, the share of new jobs in occupations with high H-1B usage that went to Black or Latino professionals was smaller than the share that went to Black and Latino professionals over the previous six-year period (9 and 11 percent vs. 13 and 13 percent).[13]
|
Share of new private-sector positions by race and ethnicity, 2013 - 2019 |
||||
|
Occupation |
White |
Black |
Asian / Pacific Islander |
Latino |
|
Computer occupations |
51% |
9% |
38% |
11% |
|
Math occupations |
62% |
5% |
25% |
17% |
|
Architecture and engineering occupations |
57% |
13% |
25% |
18% |
|
Physical and life science occupations |
40% |
6% |
58% |
31% |
|
All STEM occupations |
52% |
10% |
36% |
14% |
|
Other professional occupations |
61% |
21% |
12% |
18% |
|
All occupations |
51% |
23% |
16% |
37% |
Most H-1B beneficiaries come from two countries: India (76 percent) and China (9 percent).[15] This recruiting pipeline contributes to the over-representation of Asians and Pacific Islanders in STEM occupations. As noted above, employer usage of the H-1B visa is rooted in ability to pay H-1B workers below-market wages and employer control of the visa.[16] The ready supply of cheaper labor means employers do not have to invest in training, diversity, or education initiatives.
Perhaps not surprisingly, self-reported data shows some of the largest and most profitable tech companies making little to no progress in hiring and retaining African American and Latino professionals, despite their increased participation rates in STEM professions as a whole.
|
Racial representation among technical employees at top tech firms, 2014 and 2018 |
||||
|
Company |
African Americans, 2014 |
African Americans, 2018 |
Latinos, 2014 |
Latinos, 2018 |
|
Apple |
6% |
6% |
7% |
8% |
|
|
1% |
2% |
3% |
4% |
|
|
1% |
2% |
2% |
3% |
|
Microsoft |
2% |
3% |
4% |
5% |
There is no Evidence of a STEM Labor Shortage
Employer use of the H-1B program cannot be explained by a lack of available STEM professionals. Census Bureau data shows that there are many more STEM graduates working outside of STEM fields than within them, with 50 percent of computer science graduates working in non-STEM occupations. These rates are even higher for women, African Americans and Latinos; 62 percent of female computer sciences graduates, 62 percent of Black computer science graduates and 61 percent of Hispanic computer sciences graduates were working outside of STEM in 2017.[18]
A 2016 report from the U.S. Equal Employment Opportunity Commission cites research from the Center for Work-Life Policy that shows how more than half of women working as scientists, engineers and computer professionals quit their jobs at some point during their careers due to a variety of factors, including hostile work environments, social isolation, the need for flexible work hours and the lack of career advancement opportunities.[19] And researchers from the Kapor Center for Social Impact highlight how unfair treatment is the most frequent reason that women, African Americans and Latinos leave their tech jobs.[20]
Conclusion
Employers are using the H-1B visa program to hire foreign temporary workers at below-market wages and with limited job mobility, bypassing U.S. STEM professionals, especially women, African Americans and Latinos.
Computer occupations already make up more than half of the STEM workforce and are projected to continue growing at a rate faster than any other professional occupational group.[21] Absent reforms to the H-1B visa program, women, African Americans and Latinos will continue to have limited STEM career opportunities. The H-1B visa program must be reformed so that it works for U.S. professionals and people working on the H-1B visa, not just employers.
Related reading:
Guest Worker Visas: The H-1B and L-1
March 2020
[1] Bureau of Labor Statistics. “Table 11. Employed persons by detailed occupation, sex, race and Hispanic or Latino ethnicity, 2019.” Retrieved from https://www.bls.gov/cps/cpsaat11.htm
[2] Federal law requires “H-1B dependent employers,” companies with 15 percent or more of their workforce on H-1B visas, to attest that they recruited U.S. workers and did not displace existing workers. However, these companies can forego these obligations if they pay an H-1B worker a minimum of $60,000 or hire an H-1B worker with a master’s or advanced degree. Consequently, H-1B dependent employers commonly pay H-1B workers right at the $60,000 level, which typically is still far less than the market rate for workers in an occupation and area.
[3] Hira, Ron. “Congressional Testimony: The Impact of High-Skilled Immigration on U.S. Workers.” Economic Policy Institute. March 1, 2016. Retrieved from https://www.epi.org/publication/congressional-testimony-the-impact-of-high-skilled-immigration-on-u-s-workers-4/
[4] For the purposes of this factsheet, STEM occupations include all occupations included in the computer and mathematical occupations group, the architecture and engineering occupations group, as well as select occupations in the life, physical and social sciences group, as determined by the 2018 Standard Occupational Classification system.
[5] U.S. Department of Homeland Security, U.S. Citizenship and Immigration Services. “Characteristics of H-1B Specialty Occupation Workers.” Fiscal years 2012 - 2018 Retrieved from https://www.uscis.gov/legal-resources/buy-american-hire-american-putting-american-workers-first
[6] U.S. Census Bureau. Current Population Survey. Basic Monthly Microdata. January 2013 – December 2019. Retrieved from DataFerret.
[7] Ibid.
[8] Ibid.
[9] U.S. Bureau of Labor Statistics. “Employed persons by occupation, sex, and age, 1999.” Retrieved from https://www.bls.gov/cps/aa1999/CPSAAT9.PDF
[10] U.S. Department of Homeland Security, U.S. Citizenship and Immigration Services. “H-1B Petitions by Gender and Country of Birth.” October 5, 2018. Retrieved from https://www.uscis.gov/sites/default/files/USCIS/Resources/Reports%20and%20Studies/H-1B/h-1b-petitions-by-gender-country-of-birth-fy2018.pdf
This statistic is for all H-1B petitions, including non-STEM occupations. This rate is likely higher among H-1B beneficiaries in STEM occupations.
[11] Ibid.
[12] Ibid.
[13] U.S. Census Bureau. Current Population Survey. Basic Monthly Microdata. January 2007 – December 2019. Retrieved from DataFerret.
[14] U.S. Census Bureau. Current Population Survey. Basic Monthly Microdata. January 2013 – December 2019. Retrieved from DataFerret.
[15] U.S. Department of Homeland Security, U.S. Citizenship and Immigration Services. “Characteristics of H-1B Specialty Occupation Workers.” April 4, 2019. Retrieved from https://www.uscis.gov/sites/default/files/reports-studies/Characteristics_of_Specialty_Occupation_Workers_H-1B_Fiscal_Year_2018.pdf
[16] Costa, Daniel. “H-1B visa needs reform to make it fairer to migrant and American workers.” Economic Policy Institute. April 5, 2017. Retrieved from https://www.epi.org/publication/h-1b-visa-needs-reform-to-make-it-fairer-to-migrant-and-american-workers/
[17] Harrison, Sara. “Five years of tech diversity reports – and little progress.” Wired. October 1, 2019. Retrieved from https://www.wired.com/story/five-years-tech-diversity-reports-little-progress/
[18] U.S. Census Bureau. American Community Survey. Public Use Microdata Sample. 2017. Retrieved from DataFerret
[19] U.S. Equal Employment Opportunity Commission. “Diversity in High Tech.” May 2016. Retrieved from https://www.eeoc.gov/eeoc/statistics/reports/hightech/upload/diversity-in-high-tech-report.pdf
[20] Scott, Allison, Klein, Freada Kapor and Onavakpuri, Uriridiakoghene. “Tech Leavers Study.” Kapor Center for Social Impact. April 27, 2017. Retrieved from https://www.kaporcenter.org/tech-leavers/
[21] Bureau of Labor Statistics. “Table 1.2 Employment by detailed occupation, 2018 and projected 2028.” Retrieved from https://www.bls.gov/emp/tables/emp-by-detailed-occupation.htm.
The Young Professional Workforce
2017 Fact Sheet
Young professionals are the future of the professional workforce. They are more likely to be college graduates, work in fast-growing occupations, and be racially and ethnically diverse. Understanding this group of professionals is key to anticipating the needs of the next professional workforce.
Young professionals have their challenges. While over three million jobs have been added to the young professional workforce in the last 10 years, this growth has been outpaced by the number of college graduates looking to enter the young professional workforce. Millions of college educated young workers are either working jobs that they are more than qualified to perform or unemployed because they cannot make it into the young professional workforce. Additionally, young workers, including young professionals, are less well-off financially than their parents were at their age.
The majority of the data in this fact sheet is based on analysis of Current Population Survey (CPS) data. The CPS is a survey of households jointly sponsored by the U.S. Census Bureau and the U.S. Bureau of Labor Statistics (BLS). The CPS is the primary source for labor force data in the U.S.[i] Young professionals are defined as persons aged 20 through 34 who are working in a professional or technical occupation.
This fact sheet explores the demographics of young professionals, occupation concentration, historical employment, education attainment, unemployment and underemployment, and union membership.
Quantifying the Young Professional Workforce
In 2016, there were 17.2 million young professionals in the workforce.[ii] The professional and technical occupations of these young workers include teachers, nurses, computer programmers, civil engineers, and over 175 other occupations.[iii] The occupations fit into 10 occupational groups, established by BLS, including:
management;
business and financial operations;
computer and mathematical science;
architecture and engineering;
life, physical, and social science;
community and social service;
legal;
education, training, and library;
arts, entertainment, sports, and media; and
healthcare practitioner and technical occupations.
In 2016, 61.6 million people were employed in the 10 occupation groups that made up the professional workforce.[iv] Young professionals were 28 percent of the professional workforce (17.2 million professionals).[v] The occupation group with the highest concentration of young professionals was life, physical, and social science occupations where 35.9 percent of the professional workforce was between the ages of 20 and 34 (see the chart below). The occupation group with the lowest concentration of young professionals was management occupations where just 20.6 percent of all management occupations were held by professionals between the ages of 20 and 34.
Employment and Earnings
This section examines where young professionals were employed within the young professional workforce and their earnings.
Concentration of Young Professionals
Of the 17.2 million young professionals in 2016:
21.5 percent worked in management;
13.6 percent worked in business and financial operations;
9.5 percent worked in computer and mathematical science;
5.5 percent worked in architecture and engineering;
3.1 percent worked in life, physical, and social science;
4.3 percent worked in community and social service;
2.6 percent worked in legal occupations;
16.7 percent worked in education, training, and library occupations;
6.8 percent worked in arts, design, entertainment, sports, and media; and
16.3 percent worked in healthcare practitioner and technical occupations.[vi]
Earnings
Young professionals earned an annual average of $53,192 in 2015. The average yearly earnings for a 25-year-old young professional were $43,000 in 2015. The average 34-year-old young professional earned $69,914 in 2015.[vii]
Among all 20 to 34-year-olds, those in legal occupations had the highest yearly earnings, $72,886, followed by computer and math occupations, averaging $64,660 in 2015. Professionals in community and social service occupations as well as those in education, training, and library occupations reported the lowest annual earnings among young professionals, which were $35,981 and $37,369, respectively in 2015.[viii]
Race and Hispanic or Latino Ethnicity
The young professional workforce is more diverse than the larger professional workforce. Racial and Hispanic or Latino (hereafter Hispanic) minorities made up 33.7 percent of the young professional workforce in 2016.[ix] Among all professionals in management, professional, and related occupations, 28 percent belonged to a racial or Hispanic minority in 2016.[x]
Black professionals made up 10.8 percent of all young professionals in 2016.[xi] Among all workers in management, professional, and related occupations, 9.8 percent were Black in 2016.[xii] In 2016, 14.3 percent of the U.S. population was Black.[xiii]
In 2016, 385,974 young Black professionals worked in management occupations—which was the occupation group with the most young Black professionals. Young Black professionals made up 10.6 percent of all young professionals in management occupations. Community and social service occupations had the biggest share of young Black professionals at 21.4 percent.[xiv]
Young Black professionals also had above average concentration among 20 to 34-year-olds in healthcare practitioner and technical occupations, education and training occupations, and business and financial occupations.
Young Black professionals made up 11.3 percent of the young education, training and library occupations with 313,735 working in these occupations. Among all professionals in education, training, and library occupations, Black professionals were 10.5 percent of the workforce.
In business and financial occupations, young Black professionals were 10.8 percent of the young professionals working in these occupations with 256,155 employed in 2016.[xv]
As for healthcare practitioner and technical occupations, 12.7 percent of young professionals—or 363,042 were Black.
Hispanics made up 12.3 percent of the young professional workforce in 2016.[xvi] Among all professionals in management, professional, and related occupations Hispanics were 9.4 percent of the workforce and 17.9 percent of the U.S. population in 2016.[xvii]
Young professional Hispanics had above average concentration in six occupation groups: management (14.9 percent); community and social service (16.8 percent); arts, design, entertainment, sports, and media (14 percent); education, training, and library (12.9 percent); legal (12.5 percent); and business and financial (13.3 percent).
Asian, Hawaiian, and other Pacific Islanders (Asians) made up an estimated 11.2 percent of the young professional workforce in 2016.[xviii] Among all workers in management, professional, and related occupations, Asians were 8.9 percent of the workforce in 2016.[xix] In 2016, Asians were 6.9 percent of the U.S. population.[xx]
Among young Asian professionals, there was above average density in five of the 10 professional occupation groups in 2016.
The highest concentration of young Asians was in computer and mathematical science occupations where they made up 28.5 percent of young workers in 2016. When compared to all professionals employed in computer and mathematical science occupations, Asians made up 22 percent of professionals in 2016.[xxi]
Young Asian professionals also had above average density among young professionals in:
Business and financial occupations (11.5 percent of the young professional workforce);
Architecture and engineering occupations (12.8 percent of the young professional workforce); and
Life, physical, and social science occupations (16.9 percent of the young professional workforce).[xxii]
Asians have made the largest gains in the young professional workforce. In October 1995, Asians made up just 3.4 percent of the young professional workforce. In 2016, Asians were 11.2 percent of young professionals.[xxiii]

Gender
The young professional workforce is majority female. Women have maintained majority status in education and healthcare occupations, but men still hold most jobs in engineering and computer occupations.
In 2016, women were 54 percent of the young professional workforce. Young professional women were disproportionately represented in education occupations. They made up 71.5 percent of all professionals in education, training, and library occupations. The concentration of women was even higher among preschool and kindergarten teachers where they were 96 percent of the young professional workforce and female elementary and middle school teachers were 79 percent of the young professional workforce.[xxiv]
Similarly disproportionate numbers are also seen in several health-related occupations. For example, registered nurses, diagnostic technicians, nutritionists, and occupational therapy had heavy concentrations of women in 2016.[xxv]
However, men were heavily concentrated in computer and engineering occupations in 2016. For example, within the young professional workforce, young male professionals made up 74.7 percent of the computer-related workforce and 82.5 percent of the engineering workforce in 2016.[xxvi]
A Slow-Changing Workforce
From 2006 to 2016, the young professional workforce added nearly 3.35 million jobs, about 350,000 new jobs per year. However, this growth does not keep pace with the number of new college graduates seeking to enter the professional workforce. Between academic years 2002-03 and 2013-14, 26.9 million bachelor’s, master’s, and doctorate degrees were awarded. Another 9.1 million associate’s degrees were awarded over the same period.[xxvii]
Slow job growth has resulted in few demographic changes among young professionals in the last 10 years. Where there has been job growth among young professionals, it has been concentrated in just a handful of occupations.
In 2004, women made up 54 percent of the young professional workforce, which remained unchanged in 2016.[xxviii]
While the changes were small, the concentration of Black, Asian, and Hispanic professionals did change from 2006 to 2016. The concentration of young Black professionals increased from 8.7 percent in 2006 to 10.6 percent in 2016. Young professional Hispanics increased from 9.5 percent in 2006 to 12.3 percent in 2016. Among young professional Asians, density increased slightly from 9.3 percent in 2006 to 11.2 percent in 2016.[xxix]
From 2006 to 2016, a number of occupations experienced a significant increase in the concentration of young professionals.
Among engineers, some occupations saw declines in the employment of young professionals. However, there were big gains among young civil engineers with 70 percent growth, young chemical engineers with 40 percent growth, and young aerospace engineers increased by 30 percent.
In education, training, and library occupations, young professionals saw an overall increase of young workers, but declines in a number of occupations. However, elementary and middle school teachers along with postsecondary teachers were some of the occupations that saw gains. From 2006 to 2016, there was a 28 percent increase in the employment of young postsecondary teachers and a 10 percent increase in the employment of young elementary and middle school teachers.
The largest gains among young professionals, not surprisingly, were among professionals in healthcare occupations. Registered nurses had the highest number of new young professionals added with 316,348 more young professionals employed in 2016 than 2006, a 52 percent increase.[xxx]
Education
While job opportunities for young people may be limited, millions of new and well-educated young professionals are entering the job market every year. A survey of youth and young adults by the National Center for Education Statistics found that “from 1980 to 2009, the proportion of young adults whose highest level of education was high school completion decreased from 46 to 29 percent. Conversely, the proportion of young adults who had completed some college increased from 25 to 36 percent.”[xxxi]
In the 2013-14 academic year, over 4.8 million associate’s, bachelor’s, master’s, and doctorate degrees were awarded to all students, not just those 34 and younger.[xxxii]
Nearly 1.87 million bachelor’s degrees were conferred in 2013-14. The field with the most bachelor’s degrees conferred was business (358,079 degrees) followed by health professions (198,770), social sciences and history (173,096), and psychology (117,298). Biological and biomedical science graduated over 100,000 students and engineering and engineering technologies graduated almost 100,000 students.[xxxiii]
The greatest number of master’s degrees in the 2013-14 academic year were awarded in business (189,328), followed by education (154,636).[xxxiv]
Health professions and related programs received the highest number of doctorate degrees with 67,448 degrees awarded in 2013-14.[xxxv]
Education, Opportunity, and the Young Professional Workforce
An issue critical to young people is whether the money invested in their higher education will reap rewards with a job that will enable them to pay off student loans and join the middle class. While professional and technical jobs have provided opportunity for millions of young workers, many more millions with bachelor’s, master’s, and doctorate degrees struggle to find a good-paying jobs.
Of the 17.2 million young people in the professional workforce, 11.7 million had a bachelor’s degree or higher in 2016. That amounts to two-thirds of the young professional workforce having earned at least a bachelor’s degree.[xxxvi]
CPS tracks the highest level of education completed, which shows that nine percent of young professionals in the workforce had completed an associate’s degree, 44 percent had earned a bachelor’s degree, 17.7 percent had completed a master’s degree, and 6.1 percent had received a professional or doctorate degree in 2013. The remaining 23.1 percent had no degree or earned a high school diploma or GED. [xxxvii]
Young female professionals have higher education attainment than their male counterparts. In the young professional workforce, 6,347,457 women had earned a bachelor’s degree or higher, while 5,323,168 men had earned a bachelor’s degree or higher in 2016. Women out earned men in degrees at every level of higher education.[xxxviii]
In 2016, 82.6 percent of young professionals in life, physical, and social science occupations had at least a bachelor’s degree. Education, training, and library occupations also had very high levels of education attainment with 75.3 percent of young workers having earned at least a bachelor’s degree. Education occupations also had the highest number of master’s degrees with 781,642.[xxxix]
Management occupations showed the greatest variation in education attainment among the 3.7 million young professionals employed in those occupations. Nearly 700,000, or 38 percent of young professionals in management occupations had only completed a high school diploma/GED or less. Another 316,000 had an associate’s degree. Only 53.5 percent of young professionals in management occupations held a bachelor’s degree or higher in 2016. The disparity is largely due to the diversity of management occupations, which include CEO’s, but also food service managers.[xl]
Healthcare practitioner and technical occupations had the greatest number of young professionals with professional and doctorate degrees (over 450,000) and the greatest number of associate’s degrees (over 550,000) in 2016.[xli]

Unemployment and Underemployment
Although young professionals have lower unemployment rates when compared to all workers, hundreds of thousands of educated young people are unable to enter the professional workforce and instead work in low-wage jobs.
Of the estimated 17.2 million young professionals who reported working in one of the 10 occupational groups comprising the professional and technical workforce 2.6 percent reported being unemployed in 2016. The unemployment rate for young workers in all non-professional occupations was seven percent in 2016.[xlii]
Among young professionals, arts, design, entertainment, sports, and media occupations reported the highest unemployment rate, 5.3 percent in 2016.[xliii]
In 2016, the unemployment rate for young professionals ages 20 to 34 with a bachelor’s degree or higher was 2.1 percent. For Black professionals with a bachelor’s degree, the unemployment rate was 3.1 percent and 2.1 percent for White professionals with a bachelor’s degree.[xliv]
Underemployment is a persistent problem for young, educated professionals. Underemployment data generally track hours-based underemployment, which is a part-time worker who wants full-time work. The data does not generally account for “skills/education-based underemployment (e.g., the young college graduate working as a barista).”[xlv] Analysis of occupations based on whether they require a college degree shows that “among college graduates under the age of 25 who were working in 2014, 46 percent were not working in a job that required a college degree.” This is up from 31.1 percent in 2007.[xlvi]
There were over two million workers between the ages of 20 and 34 with a bachelor’s degree or higher working in food preparation and serving, building and grounds cleaning, personal care and service, and office and administrative support occupations in 2016. The vast majority of the occupations in these sectors, if not all of them, do not require a bachelor’s degree or higher.[xlvii]
According to a study by Accenture Strategy, 51 percent of 2014/2015 college graduates reported being employed in jobs that did not require their college degree. This is a 10 percent increase from 2013. Additionally, 39 percent of 2014/2015 college graduates reported making less than $25,000 a year.[xlviii]
Those who graduated from college in 2015 had on average $35,051 in student loan debt, the highest rate of education debt to date.[xlix]
According to Federal Reserve data, in 2013, the median college-educated 25 to 34 year-old only made slightly more than a high school educated baby boomer (those born between 1946 and 1964) in 1989. The median household income of 25 to 34 year-olds is $40,581—which is 20 percent less than the household income of baby boomers at the same point in life. The median net worth of 25 to 34 year-olds is 56 percent less than it was for baby boomers—$10,090.[l]
Union Membership
Union membership among young professionals grew steadily from 1994 to 2016, even outpacing growth in the young professional workforce. Women made up the majority of young professional union members in 2016. Young professionals increased both by the number of union members and union density between 1994 and 2016.
According to CPS data, approximately 1.38 million young professionals were union members in 2016. All 10 professional occupation groupings employed young union members. However, young union members were heavily concentrated in education, training, and library occupations; community and social service occupations; and healthcare practitioner and technical occupations.[li]
27 percent of young professionals in education, training, and library occupations were union members in 2016.
Of the young professionals in life, physical, and social science occupations, five percent were union members.
Healthcare practitioner and technical occupations had the third highest density rate of union members, 11.3 percent in 2016.[lii]
Gender Differences
Of the 1.43 million young professionals who were union members in 2016, 67.4 percent were women. This majority is largely due to their disproportionate concentration in education, training, and library occupations where over 127,278 women were union members in 2016. There were just 48,010 young male union members in education, training, and library occupations in 2016.[liii]
Men made up a larger portion of union members in computer and mathematical science, architecture and engineering, and arts and media occupations.
Trends, 1994 to 2016
Union density among young professionals increased slightly from 8.2 percent in 1994 to 9.2 percent in 2016.
The number of young professional union members rose from 1,050,848 in 1994 to 1,431,477, a 36.2 percent increase. The young professional workforce grew 22.2 percent from 1994 to 2016.
Many professional occupation groups saw an increase in the number of union members from 2006 to 2016.[1] Young professionals in business and financial occupations grew from 55,964 union members in 2006 to 71,195 in 2016; arts and entertainment occupations averaged 35,156 in 2006 and 40,800 in 2016; and healthcare practitioner and technical occupations grew from 197,807 in 2006 to 309,607 in 2016.[liv] Union membership among young professionals in management occupations, computer and mathematical science occupations, community and social service occupations, and legal occupations also grew from 2006 to 2016.
Conclusion
While young professionals are a diverse and educated group, many educated young people cannot break their way into the professional workforce. Investment in research, education, infrastructure, and similar sectors is needed to grow the professional workforce. Another challenge young workers, including young professionals, face is many are less well-off than their parents were at their age—in terms of income, debt, and economic mobility. One effective way to make gains in this area is through union membership. In the general, union members have higher wages, better benefits, and working conditions than non-union members. Increases in union membership in the young professional workforce demonstrates that many young professionals realize the advantages of having a union.
Related reading:
The Union Difference for Working Professionals
I'm a Professional. What can a union do for me?
March 2017
[1] The occupation categories from the 1994 CPS data are different than 2016, making comparison of specific occupation groups from 1994 to 2016 impossible. However, occupation groups are the same for 2006 and 2016, so the analysis will focus on this 10-year change.
[i] See U.S. Department of Commerce, United States Census Bureau, Current Population Survey, A Joint Effort Between the Bureau of Labor Statistics and the Census Bureau. On the web at www.census.gov/cps/.
[ii] U.S. Census Bureau, DataFerrett, Current Population Survey, Monthly Microdata, 2016.
[iii] U.S. Census Bureau, DataFerrett, Current Population Survey, Monthly Microdata, Average of January through June, 2016.
[iv] Ibid.
[v] Ibid.
[vi] U.S. Census Bureau, DataFerrett, Current Population Survey, Monthly Microdata, 2016.
[vii] U.S. Census Bureau, DataFerrett, American Community Survey, Public Use Microdata, 2015.
[viii] Ibid.
[ix] U.S. Census Bureau, DataFerrett, Current Population Survey, Monthly Microdata, 2016.
[x] Ibid.
[xi] Ibid.
[xii] U.S. Census Bureau, DataFerrett, Current Population Survey, Monthly Microdata, 2016.
[xiii] U.S. Census Bureau, DataFerrett, Current Population Survey, Monthly Microdata, 2016.
[xiv] U.S. Census Bureau, DataFerrett, Current Population Survey, Monthly Microdata, 2016.
[xv] Ibid.
[xvi] Ibid.
[xvii] U.S. Census Bureau, DataFerrett, Current Population Survey, Monthly Microdata, 2016.
[xviii] U.S. Census Bureau, DataFerrett, Current Population Survey, Monthly Microdata, 2016.
[xix] Ibid
[xx] U.S. Census Bureau, DataFerrett, Current Population Survey, Monthly Microdata, 2016
[xxi] U.S. Census Bureau, DataFerrett, Current Population Survey, Monthly Microdata, 2016.
[xxii] Ibid.
[xxiii] U.S. Census Bureau, DataFerrett, Current Population Survey, Monthly Microdata, Average of October, November, and December 2013, October 1995 and 2016.
[xxiv] U.S. Census Bureau, DataFerrett, Current Population Survey, Monthly Microdata, 2016.
[xxv] Ibid.
[xxvi] Ibid.
[xxvii] U.S. Department of Education, National Center for Education Statistics, Digest of Education Statistics, Tables 321.10,322.10, 323.10, 324.10
[xxviii] Ibid.
[xxix] Ibid.
[xxx] Ibid.
[xxxi] Susan Aud, “America’s Youth: Transitions to Adulthood.” National Center for Education Statistics, December 2011.
[xxxii] U.S. Department of Education, National Center for Education Statistics, Digest of Education Statistics, Table 301.10. Degrees/Certificates conferred, 2011-12.
[xxxiii] U.S. Department of Education, National Center for Education Statistics, Digest of Education Statistics, Table 322.10. Bachelor’s degrees conferred by postsecondary institutions, by field of study: Selected years, 1970-71 through 2011-12.
[xxxiv] U.S. Department of Education, National Center for Education Statistics, Digest of Education Statistics, Table 323.10. Master’s degrees conferred by postsecondary institutions, by field of study: Selected years, 1970-71 through 2011-12.
[xxxv] U.S. Department of Education, National Center for Education Statistics, Digest of Education Statistics, Table 324.10. Doctor’s degrees conferred by postsecondary institutions, by field of study: Selected years, 1970-71 through 2011-12.
[xxxvi] U.S. Census Bureau, DataFerrett, Current Population Survey, Monthly Microdata, 2016.
[xxxvii] Ibid.
[xxxviii] Ibid.
[xxxix] Ibid.
[xl] Ibid.
[xli] Ibid.
[xlii] Ibid.
[xliii] Ibid.
[xliv] Ibid.
[xlv] Alyssa Davis, Will Kimball, and Elise Gould, “The Class of 2015: Despite an Improving Economy, Young Grads Still Face and Uphill Climb.” EPI Briefing Paper, May 27, 2015. Retrieved from http://www.epi.org/publication/the-class-of-2015/
[xlvi] Ibid.
[xlvii] U.S. Census Bureau, DataFerrett, Current Population Survey, Monthly Microdata, 2016.
[xlviii] Dishman, Lydia. "The Class Of 2016 Is Both Practical And Idealistic About Their Job Prospects." Fast Company, May 12, 2016. Accessed March 15, 2017. https://www.fastcompany.com/3059810/the-future-of-work/the-class-of-2016-is-both-practical-and-idealistic-about-their-job-prospe.
[xlix] Dishman, Lydia. "The Class Of 2016 Is Both Practical And Idealistic About Their Job Prospects." Fast Company, May 12, 2016. Accessed March 15, 2017. https://www.fastcompany.com/3059810/the-future-of-work/the-class-of-2016-is-both-practical-and-idealistic-about-their-job-prospe.
[l] Ap. "Millennials earn 20% less than Boomers did at same stage of life." USA Today. January 13, 2017. Accessed March 15, 2017. http://www.usatoday.com/story/money/2017/01/13/millennials-falling-behind-boomer-parents/96530338/.
[li] Ibid.
[lii] Ibid.
[liii] Ibid.
[liv] U.S. Census Bureau, DataFerrett, Current Population Survey, Monthly Microdata, 2016.
Professional Women: A Gendered Look at Inequality in the U.S. Workforce
2017 Fact Sheet
This fact sheet analyzes the state of women in the professional workforce. It is divided into two parts: Identifying Barriers and Crafting Solutions.
Part I identifies and overviews the problems that professional women currently face in the U.S. workforce. This fact sheet will primarily focus on wage inequality, but will also touch on issues like biases in academia, the cost of childcare, inadequate family leave policies, and pay secrecy.
Part II focuses on solutions to closing the wage gap and the various other issues that prevent women from achieving equality at work. At the individual level, women can make gains at closing the wage gap by joining or forming a union, as the gap among union members is much narrower than among non-union professionals. To achieve systematic change, legislation at the state and federal levels must be enacted to allow women to have the same ability to join the workforce as men and to prevent pay discrimination.
Women made great progress towards equality in the workplace during the last century, signaling the problems of this century can be overcome.
Part I: Identifying Barriers
A Historical Perspective of Women at Work
The number of women (single, married, childless, or mothers) who work has undergone a dramatic shift in the last 100 years. At the beginning of the 20th century, only about one fifth of women worked. Today, the majority of women are in the workforce.
The number of working women in the United States has risen from 5.1 million in 1900, to 18.4 million in 1950, to 73.5 million in 2015.[1]
Women accounted for 18 percent of the labor force in 1900 and 47 percent in 2015.[2]
While in 1900 only 20.4 percent of all women worked, in 2015 about 57 percent of women were in the labor force.[3]
In 2015, women made up the majority, 51.5 percent, of workers in management, professional, and related occupations.[4]
However, women only hold 4.4 percent of CEO positions at S&P 500 companies.[5]
Labor force participation has increased most dramatically among married women—with 68 percent in the labor force.[6]
Most mothers, even those with young children, participate in the labor force.[7] In 2015, 64 percent of mothers with children under the age of six were in the workforce. Most of them worked full-time.[8] Among all mothers with children under 18, 71 percent were in the labor force.[9] In the professional workforce, 39 percent of female workers had children under 18.[10]
A little over half of all multiple job holders in 2015 were women, up from 22 percent in 1974. Women are the majority (64 percent) of temporary and part-time workers.[11]
Occupational Distribution Differs Between Men and Women
Although women constitute the majority of professional employees, their occupational distribution remains concentrated in jobs traditionally held by women, while they struggle to establish a foothold in male dominated fields, like engineering and computer science.
In 2015, 75 percent of healthcare practitioner and technical occupations and 73 percent of education, training, and library occupations were held by women.[12]
In comparison, women filled only 25 percent of computer and mathematical occupations, and 15 percent of architecture and engineering occupations in 2015.[13]
Still, the different distribution of men and women among specific professional occupations was less pronounced in 2015 than 30 years prior.
The percentage of technical writers who were female increased from 36 percent to 58 percent between 1985 and 2015.[14]
Women pharmacists increased from 17 percent in 1985 to 57 percent in 2015.[15]
The percentage of female chemists increased from 21 percent in 1985 to 36 percent in 2015.[16]
Women and Education: Leaping the Gap
Women have made significant strides in closing the education gap but remain underrepresented in the science, technology, engineering, and mathematics (STEM) fields. STEM jobs tend to be higher paying than many other professional occupations.
Women have been earning more bachelor’s degrees than men since 1982 and they have been earning more master’s degrees than men since 1987.[17]Women received 57 percent of bachelor’s degrees in the 2013–2014 academic year.[18]
Women earned 52 percent of all doctoral degrees in academic year 2013–14, while in 1971 they earned only 10.6 percent of all doctoral degrees.[19]
The proportion of women in law school increased from 4.2 percent in 1963–64 to 47 percent in academic year 2012–13.[20]
In 2016, women were 48 percent of all students enrolled in medical school.[21]
“Women make up almost exactly half of all recent STEM graduates. But they make up less than a quarter of all graduates in the 20 highest-paying STEM fields, and more than two-thirds of graduates in the 20 lowest-paying majors.”[22]
Men and women remain segregated by college major, with women making up nearly 80 percent of education majors and men making up 80 percent of engineering majors. The support and opportunity for women to pursue careers in STEM fields are important for achieving pay equity. In science and engineering, for example, women are still paid less than men but tend to earn more than similarly educated women in other sectors of the workforce.[23]
Studies have shown that there is bias against women in the STEM fields—hiring decisions for lab positions, selection for mathematical tasks, evaluation of research abstracts for conferences, research citations, invitations to speak at symposia, postdoctoral employment and tenure decisions all disfavor women.[24]
To further enforce this point, a study by science researchers at Yale, found that there is a “pervasive” discrimination towards female undergraduates in the science fields. The study found that science professors in American universities widely regard female undergraduates as less competent than their male counterparts with the same accomplishments and skills. The report found that professors were less likely to offer women mentoring or employment; and if they were offered a job, the salary was lower.[25]
Women accounted for only 14 percent of all physics professors in the country, which is an example of how the problem becomes compounded, and hold just 20 percent of physics Ph.D.’s in the U.S.[26]
More troubling, another study found that male STEM professors are less likely to believe the body of research showing there is systematic biases against women in STEM. Men make up 71 percent of STEM faculty.[27]
The Gender Wage Gap Persists
The gender wage gap still plagues the American workforce. In 2015, women working full-time wage and salary jobs earned only 81 percent of what men earned.[28] The gap has persisted over the years, despite the fact that women are currently earning the majority of college degrees.[29] The gender wage gap has high costs for women over the course of their careers. The average college educated woman loses almost $800,000 in wages over her lifetime.[30]
In 2015, men’s median earnings were $51, 212 while women’s median earnings were $40,742.[31]
For most minority women, the earnings gap compared to white men was even larger. In 2015:
African American women earned 67 percent of what white men earned.
Hispanic women earned 62 percent of what white men earned.
When minority women’s earnings are compared to minority men’s, the gap is not as wide. However minority women reaching parity with minority men is not equality as Black men make 76 percent of what White men make and Hispanic men earn 69 percent of what White mean earn.[32]
African American women earned 90 cents for every dollar earned by Black men.
Hispanic and Latina women earned 90 cents for every dollar Hispanic or Latino men earned.
Asian American women earned only 78 percent as much as Asian American men.[33]
Equal pay remains a problem in every occupational category. In 2014, a number of professions showed a significant gap.
While women comprised 55 percent of workers in professional and related occupations, they earned 28 percent less than their male counterparts.
Female elementary and middle school teachers earned 11 percent less than similarly employed men, despite comprising approximately 81 percent of the field.
Female postsecondary teachers earned about 19 percent less than equivalent men.
Female physicians and surgeons earned 20 percent less than their male counterparts.
Female lawyers earned almost 10 percent less than male lawyers.[34]
Progress has slowed on closing the wage gap.
In the last 25 years, progress made on closing the wage gap has only amounted to about 10 cents—in 1990 women made 70 cents for every dollar men made and in 2015 women made 80 cents for every dollar men made.[35]
In the 1980s, the wage gap narrowed by nine cents.[36]
Earlier in their career the pay gap is smaller for women than later in their career.
In 2014, women who were 25 to 34 made 90 percent of what men made, while women 35 to 44 only made 81 percent of what men of their age made.[37]
The difference in the pay gap at different points in women’s careers is mainly due to the effects of childbirth and marriage.[38]
New research suggests that women are paid less because their work is valued less than men’s work.
A study analyzing Census data from 1950 through 2000 found that when the number of women increase in an occupation, the pay for those jobs decreases—even when controlling for education, work experience, skills, race and geography.[39]
The findings suggest that as more women go into historically male-dominated professions, the pay will drop.
When more women became biologists, wages fell by 18 percent.[40]
The study also found that the reverse was true—when an occupation attracted more men, wages went up. [41]
Women also earn less at every level of education. For full-time workers age 25 and older in 2015:
Women without a high school diploma earned $418 in median weekly wages, while men earned $520.
Women with a bachelor’s degree or higher earned $1230, while men with a comparable education earned $1420.[44]
A 2011 report by the American Association of University Women found that women who attended highly selective colleges earn less than men from either highly or moderately selective colleges, and about the same as men from minimally selective colleges.[45]
The Gender Wage Gap Costs Working Families
The disparity between the pay of men and women has a negative impact on working families.
“More than 12 million families with children rely primarily on women’s earnings.”[46]
Over a third of mothers in working families in every state, except Wyoming and Utah, are the family’s primary breadwinner, either as single working mothers, or by providing at least half of a family’s earnings.[47]
The gender wage gap took on added importance as men were more likely than women to lose jobs during the last recession. This drop in male employment forced millions of families to rely mainly on a woman’s paycheck to make ends meet. During the economic downturn, the persistent gender pay gap further stressed working families, as it cost U.S. women $200 billion annually.[48]
The overall labor force participation rate of mothers with children younger than 18 was 69.9 percent in 2015.[49] The labor force participation rate of single mothers was 74.8 percent in 2015.[50]
In 2014, over 27 percent of children lived with only one parent (up from 12 percent in 1970), with about 82.5 percent of these children living with their mothers. The poverty rate of custodial mothers was 31 percent in 2014, while poverty rate for custodial fathers was 17 percent.[51]
In 2015, among Black single mothers, approximately 35.2 percent were below the poverty line, compared to 25.4 percent of White single mothers.[52]
A report by the AFL-CIO and the Institute for Women’s Policy Research found that if the wage gap were eliminated, the income of single women would rise 13.4 percent, single mothers would earn 17 percent more, and married women would earn six percent more. These increases would lead to reductions in poverty of 84 percent for single women, 50 percent for single mothers, and 62 percent for married women.[53]
The Gender Wage Gap Significantly Affects Retirement Benefits
The gender wage gap has important long-term consequences. Although women are the majority of beneficiaries of Social Security and other retirement benefits, in general they receive lower benefits than their male counterparts.
Women represented 56 percent of all Social Security beneficiaries age 62 and older and approximately 66 percent of beneficiaries age 85 and older in 2014.[54] While Social Security does not discriminate based on gender, historical lower income affects women’s benefits.
In 2014, the average annual Social Security income received by women 65 years and older was $13,150, compared to $17,106 for men.[55]
“In 2014, for unmarried women – including widows – age 65 and older, Social Security comprised 47 percent of their total income, while it comprised only 34 percent of unmarried men’s total income.”[56]
Elderly women are less likely than elderly men to have significant family income from pensions other than Social Security. For 30 percent of women beneficiaries 65 or older Social Security is virtually their only source of income but only 25 percent for men.[57]
Among people 65 and older, 12.1 percent of women were living in poverty, while only and 7.4 percent of men were living in poverty in 2014.[58]
The American Association of Retired Persons estimates that unmarried women received approximately $8,000 less in annual retirement income than their male counterparts. Two-thirds of this disparity is directly attributable to the wage gap and employment segregation.[59]
Pay Secrecy
Over the past fifteen years, several states have adopted pay secrecy legislation that prohibits or discourages employees from any discussion of their pay with colleagues. This legislation helps to perpetuate gender pay disparities.
Slightly more than half of all workers (51 percent of women and 47 percent of men) report that the discussion of wage and salary information is either discouraged or prohibited and could lead to punishment. This number is highest in the private sector, where 62 percent of women say that their wage and salary information is secret. [60]
In April 2014, President Barack Obama issued an executive order that prohibits any federal contractor, subcontractor, or federally assisted construction contractors from discharging an employee for discussing pay with another employee. In addition, Section 7 of the NLRA covers non-supervisory employees from employer retaliation when they discuss wages or working conditions with their colleagues as part of a concerted activity to improve working conditions.[61]
In the 1982 and 1985, Michigan and California enacted “anti-pay secrecy laws.” Then, between 2000 and 2015 ten additional states, including Colorado, Connecticut, Illinois, Louisiana, Maine, Minnesota, Oregon, New Jersey, Vermont, and New Hampshire enacted similar legislation.[62] Anti-pay secrecy laws prohibit employers from disciplining employees who discuss their pay with colleagues.
Additional Barriers for Working Women
Working women also face other barriers that are not strictly related to pay. These obstacles can contribute to inequality in the workplace—including the wage gap—as well as generally disadvantage women.
The Price of Childcare
In the U.S., childcare can be prohibitively expensive. The average cost of childcare at a daycare center or nursery school exceeds 24 percent of the median income for single parents. For a married couple, the average cost is between seven percent and 16 percent of the median income in their state.[63] The high cost of childcare tends to take women out of the workforce. For parents who work, breakdowns in childcare cause parents to miss more days of work. Women who leave the workforce to take care of children miss out on not only the salary they would have earned if they continued working but also wage growth—not to mention lost retirement assets and benefits.[64]
The availability of affordable childcare can have a large impact on women’s choices regarding work. The annual cost of full-time care can range from $4,822 to $17,062 for an infant-based care center, and the annual cost for a four year-old ranges from $3,997 to $12,781.
Though, the cost of childcare for an infant in Washington, D.C. at a daycare center for a year is $22,658.[65]
In the U.S., about 60 percent of childcare is paid for by the parents.[66]
For households in the Northeast and Midwest, center-based care for two children is the single highest household expense. In the West and the South, child care costs are the biggest expense after housing costs.[67]
45 percent of parents were absent from work at least once during a six month period due to child care breakdown—one average they missed 4.3 days.[68]
It’s estimated that U.S. businesses lose $4.4 billion annually because of child care breakdowns.[69]
A 26-year-old woman who was making $44,000 and took five years off to take care of a child would lose over a half a million dollars in income.[70]
Investment in childcare support programs would help boost women’s participation in the labor force—as seen in other countries—and, in turn, could boost the GDP of the U.S. by $600 billion annually.[71]
Increased participation in the labor force by women could help close the gender wage gap.[72]
The Organization for Economic Cooperation and Development (OECD) consists of 34 high-income countries and provides an international platform to compare economic and policy experiences, seek answers to common problems, and coordinate international efforts. The U.S. ranks 37th of 40 OECD countries on public expenditures on early childhood education and care.
Inadequate Family Leave, Sick Leave, and Paid Time Off
Inadequate paid leave in the U.S. particularly hurts women, especially lack of paid leave after the birth of a child.
The U.S. is the only OECD country to not require paid leave for new parents—all other countries require at least around two months of paid leave. [73]
A study out of Rutgers University, found that women in New Jersey who used paid family leave were far more likely than those who did not to be working nine months to a year after their child was born.[74]
A report published by the Human Rights Watch that interviewed 64 parents from across the U.S., found that those with little or no paid leave after having or adopting a child tended to have health problems and often delayed their child’s immunizations. A number of those who chose to take unpaid leave would go into debt. Some of the women surveyed reported that their career was hurt due to their employer’s bias against working mothers.[75]
Unlike other high-income countries, the U.S. does not guarantee workers paid sick leave.[76]
About 40 million private-sector employees do not have paid sick time.[77]
Workers without paid sick time tend to do to work sick, being less productive, which costs both them and their employer.[78]
Missing three and a half days of work due to being sick is equal to the cost of a month of groceries for an average family.[79]
Paid sick leave increases workers’ ability to keep their jobs. Workers who have paid sick leave are eight percent more likely to stay in their job for five months.[80]
The U.S. only has 10 federal holidays, which not all employees in the U.S. receive off.[81]
Women are more likely to work part-time—often because they have no other choice—and most part-time positions receive little or no paid vacation or sick days. [82]
Part II: Crafting Solutions
Women and the Union Advantage
On average, union members have higher pay and better benefits than non-union members. The wage gap between union men and women is narrower than the wage gap among non-union men and women. Joining or forming a union is a step women can take at the individual level to increase wage equality.
Women who are members of a union make 91 percent of what men in unions make, while non-union female workers only make 80 percent of what non-union male workers make.[83]
In 2015, union women earned weekly wages that were 33 percent more than non-union women.
The union difference is apparent in the median hourly wages of predominantly female occupations. Union preschool and kindergarten teachers earned 96 percent more than their non-union counterparts, while for elementary and middle school teachers, the union members earned 39 percent more. For registered nurses, union members earned 21 percent more than non-union nurses.
Union women and men are more likely than non-union workers to have health and pension benefits, and to receive paid holidays and vacations, and life and disability insurance.
In 2015, 10.6 percent of working women were union members.[84]
In 2015, 46 percent of all union members were women, up from 19 percent in 1962.[85] The union membership gap between men and women has narrowed considerably since 1986, when the union membership rate for men was about 32 percentage points higher than the rate for women.[86] Women are projected to surpass men and become the majority of union members by 2025. [87]
Among professional and related occupations, 16.8 percent were union members. Women made up 66 percent of union members in professional and related occupations.[88] [89]
Education professions, most of which are majority female, consistently have some of the highest unionization rates.[90] In 2015, among elementary and middle school teachers, 48.5 percent were union members and 78 percent of those members were women. In union organizing elections, majority-female occupations have consistently shown much higher win rates than organizing drives in industries with fewer women members.[91] [92]
African American and Hispanic and Latina women also benefit from union membership:
The median weekly earnings of African American union women were 31 percent more than their non-union counterparts.[93]
Hispanic and Latina women who were union members had median weekly earnings that were 44 percent higher than their non-union counterparts. [94]
Public Policy
Legislation should be part of the conversation when considering ways to achieve equality for working women. A variety of issues that contribute to the wage gap by preventing women from staying in the workforce and having equal opportunities at work could be solved with legislation.
Guaranteeing Paid Sick Leave
In 2007, San Francisco implemented a law that allows all workers to earn and use paid sick days. The Institute for Women’s Policy Research surveyed workers in San Francisco after the law went into effect and found that half of all workers reported some sort of benefit from the policy. Parents surveyed were less likely to send a sick child to school and 86 percent of employers said there was not a negative effect on profitability due to the policy.[95]
Paid sick days can prevent workers from putting their families’ health and financial security at risk every time someone in the family is sick, reduce the spread of sicknesses, and decrease health care costs by reducing emergency room visits. [96]
The vast majority of voters support paid sick days for workers. [97]
Four states—Connecticut, California, Massachusetts, and Oregon—have statewide paid sick leave laws currently in effect. In 2016, Washington, Arizona, and Vermont passed sick days laws. A number of cities, including New York City, Washington, D.C., and Philadelphia also have paid sick leave laws.[98]
Studies of the effects of paid sick leave laws in New York City, Connecticut, and Washington, D.C. have found positive results. In New York City, the unemployment rate was down, private sector business grew, and prices for consumers fell. In Connecticut, employment increased in sectors most affected by the law. In Washington, D.C., an audit of the law showed it did not harm business. [99]
A 2010 report on federal legislation (Healthy Families Act) that would have expanded paid sick leave found that 13.3 million women workers would have benefited from the bill by being able to accrue paid sick leave.[100]
Mandating Paid Family Leave
California, New Jersey, and Rhode Island have paid family leave laws in place. New York passed paid family leave in 2016, but the law does not go into effect until 2018. Washington, D.C. has also passed paid family leave.[101]
According to economists, paid family leave allows more workers to take time off—specifically benefiting poor parents. Mothers who might have dropped out of the workforce after having a child are more likely to come back to work if they have paid family leave.[102]
A study of California’s paid leave law found mothers who took leave were six percent more likely to be employed a year later than those who did not take leave. [103]
A study of New Jersey’s paid leave law found that, in the year after having a child, mothers who took paid leave were less likely to be on food stamps or to receive public aid.[104]
Women who took paid leave worked more hours two years after their child was born and had higher hourly wages.[105]
A 2012 poll found that 75 percent of respondents viewed New Jersey’s paid leave law favorably.[106]
Making Child Care Affordable
Using subsidies to cut the cost of child care down to 10 percent of family income increases overall family income. Doing this has the potential to increase GDP by around $210 billion due to an increase in women’s participation in the workforce.[107]
A study looking at child care in Quebec found that every one percent increase in subsidies increased the percent of mothers in the workforce by .24 percent.[108]
Decreasing the cost of childcare by 10 percent would increase the employment rate for single women by two percent and married women by 10 percent. [109]
The employment rate among mothers would increase by up to 10 percent if early-childhood education was funded entirely by the government.[110]
Strengthening Equal Pay Laws
Research has found that part of the wage gap can be explained by factors such as men and women working in different occupations and women working fewer hours, but there is a portion of the wage gap that cannot be explained. One conclusion is that this unexplained portion is due to wage discrimination. [111] [112]
Since the Equal Pay Act was signed in 1963—requiring men and women be paid equally for equal work—the wage gap has narrowed by 22 cents.[113]
Overtime, the Equal Pay Act’s protections have been weakened. One example of this is broad interpretation by the courts of employers’ defenses outlined in law, which has made it easier for employers to claim that employees received different pay for a reason other than sex, allowing them to avoid liability for sex discrimination. Also, the Equal Pay Act does not specifically address pay transparency or pay secrecy.[114]
The Paycheck Fairness Act, or similar legislation, would strengthen the Equal Pay Act.[115]
The act would allow those who are discriminated against to sue for full compensatory and punitive damages. This would impose a real consequence on employers who discriminated based on sex.
It would let class actions be brought under the current federal rule, where those who were damaged are automatically considered as part of the class.
The Paycheck Fairness Act also has an anti-pay secrecy component, preventing employers from retaliating against employees for sharing salary information.
It would close a loophole to ensure that employers demonstrate that a difference in pay between men and women is actually caused by something other than sex.
The act would also clarify what salary comparisons can be made when examining whether an employer is paying employees different salaries for the same work.
Another component of the act is to strengthen the Equal Employment Opportunity Commission (EEOC) by improving how it collects compensation data.
Additionally, it would require employment data to be collected and analyzed to detect wage discrimination.
Conclusion
Although women make up almost half the labor force they still do not receive the same treatment and opportunities as men. The wage gap—despite seeming small to some—has a large ripple effect, which impacts almost every aspect of women’s lives. The work of labor unions, fighting for better wages and benefits, makes a huge difference for working women and should be part of the solution to close the wage gap and achieve equality in the workplace. Additionally, government policies that allow women who want to participate in the labor force work and pursue the careers that interest them, is another key component of a comprehensive solution. Although the Equal Pay Act of 1963 made gains at curbing pay discrimination it still remains a problem in the U.S. and contributes to the wage gap. Legislation building on the Equal Pay Act should also be considered a necessity in solving the gender wage gap and achieving equality for women in the workplace.
Related reading:
The Union Difference for Working Professionals
I'm a Professional. What can a union do for me?
February 2017
[1] U.S. Department of Labor, Bureau of Labor Statistics, “Perspectives on Working Women: A Databook,” Bulletin 2008, 1980 “Employment Status of the Civilian Noninstitutional Population by Age, Sex, and Race.” U.S. Bureau of Labor Statistics. February 10, 2016. Accessed December 14, 2016. https://www.bls.gov/cps/cpsaat03.htm.
[2] U.S. Department of Labor, Bureau of Labor Statistics, Current Population Survey, “Perspectives on Working Women: A Databook,” 1980; U.S. Department of Labor, Bureau of Labor Statistics, Current Population Survey, Table 11, “Employed persons by detailed occupation, sex, race, and Hispanic or Latino ethnicity,” 2015.
[3] U.S. Department of Labor, Bureau of Labor Statistics, “Perspectives on Working Women: A Databook,” 1980; “Employment Status of the Civilian Noninstitutional Population 16 Years and over by Sex, 1975 to Date.” U.S. Bureau of Labor Statistics. February 2016. Accessed December 14, 2016. https://www.bls.gov/cps/cpsaat02.htm.
[4] “Employed Persons by Detailed Occupation, Sex, Race, and Hispanic or Latino Ethnicity.” U.S. Bureau of Labor Statistics. February 10, 2016. Accessed December 14, 2016. https://www.bls.gov/cps/cpsaat11.htm.
[5] “Women CEOs of the S&P 500.” Catalyst. January 03, 2017. Accessed January 13, 2017. http://www.catalyst.org/knowledge/women-ceos-sp-500.
[6] Roberts, Evan, “Labor Force Participation by Married Women in the United States, Results from the 1917/19 Cost-of-Living Survey and the 1920 PUMS,” Presented at the 28th Social Science History Association Conference. November 2003. http://users.pop.umn.edu/~eroberts/evanrobertssshapaper.pdf; Department of Labor, Bureau of Labor Statistics, “Employment Characteristics of Families—2012.” Table 5.
[7] U.S. Department of Labor, Bureau of Labor Statistics, “Women in the Labor Force: A Databook,” December 2015.
[8] Department of Labor, Bureau of Labor Statistics, “Employment Characteristics of Families—2015.” Table 5.
[9] “Employment Characteristics of Families Summary.” U.S. Bureau of Labor Statistics. April 22, 2016. Accessed January 24, 2017. https://www.bls.gov/news.release/famee.nr0.htm.
[10] U.S. Census Bureau, DataFerrett, American Community Survey, Public Use Microdata Sample, 2016.
[11] “Multiple Jobholders by Selected Characteristics.” U.S. Bureau of Labor Statistics. February 10, 2016. Accessed December 14, 2016. https://www.bls.gov/cps/cpsaat36.htm; U.S. Department of Labor, Bureau of Labor Statistics, Current Population Survey, Table 8, “Employed and unemployed full- and part-time workers,” 2015. http://www.bls.gov/cps/cpsaat08.htm.
[12] U.S. Department of Labor, Bureau of Labor Statistics, Current Population Survey. Table 11, “Employed persons by detailed occupation, sex, race, and Hispanic or Latino ethnicity,” 2015.
[13] Ibid.
[14] Ibid., Wootton, Barbara H. Gender differences Gender differences in occupational employment in occupational employment. Publication. April 1997. https://stats.bls.gov/mlr/1997/04/art2full.pdf.
[15] Ibid.
[16] Ibid.
[17] U.S. Department of Education, National Center for Education Statistics, Digest of Education Statistics, Table 283, “Degrees conferred by degree-granting institutions, by level of degree and sex of student: Selected years, 1869-70 through 2021-22.” http://nces.ed.gov/programs/digest/d12/tables/dt12_283.asp.
[18] “Postsecondary Degrees” https://nces.ed.gov/programs/digest/d15/
[19] U.S. Department of Education, National Center for Education Statistics, Digest of Education Statistics, Table 301.10 Enrollment, staff, and degrees/certificates conferred in degree-granting and non-degree-granting postsecondary institutions, by control and level of institution, sex of student, type of staff, and level of degree: Fall 2013, fall 2014, and 2013-14, http://nces.ed.gov/programs/digest/d15/tables/dt15_301.10.asp.
[20] Enrollment and Degrees Awarded, 2012-2013 Academic Year. American Bar Association Section of Legal Education and Admissions to the Bar.
www.americanbar.org/content/dam/aba/administrative/legal_education_and_admissions_to_the_bar/statistics/enrollment_degrees_awarded.pdf
[21] Association of American Medical Colleges, “Total Enrollment by U.S. Medical School and Sex, 2012-2013 through 2016-2017” Table B-1.2. https://www.aamc.org/data/facts/enrollmentgraduate/158808/total-enrollment-by-medical-school-by-sex.html.
[22] Casselman, Ben. “Women are Majoring in the Lower Paying STEM Fields,” September 12, 2014 http://fivethirtyeight.com/datalab/women-are-majoring-in-the-lower-paying-stem-fields/.
[23] U.S. Department of Education, National Center for Education Statistics, Digest of Education Statistics, Table 319, “Degrees in education conferred by degree-granting institutions,” http://nces.ed.gov/programs/digest/d12/tables/dt12_319.asp; U.S. Department of Education, National Center for Education Statistics, Digest of Education Statistics, Table 320, “Degrees in engineering conferred by degree-granting institutions,” http://nces.ed.gov/programs/digest/d12/tables/dt12_320.asp.
[24] Cook, Lindsey. “More Depressing News for Women in STEM.” U.S. News and World Report, January 6, 2016. http://www.usnews.com/news/blogs/data-mine/articles/2016-01-06/researchers-show-male-stem-faculty-less-likely-to-support-research-showing-gender-bias.
[25] Chang, Kenneth. “Bias Persists for Women of Science, a Study Finds,” The New York Times, September 24, 2012.
[26] Pollack, Eileen. “Why are There Still So Few Women in Science?” New York Times, October 13, 2013. http://www.nytimes.com/2013/10/06/magazine/why-are-there-still-so-few-women-in-science.html.
[27] Cook, Lindsey. “More Depressing News for Women in STEM.” U.S. News and World Report, January 6, 2016. http://www.usnews.com/news/blogs/data-mine/articles/2016-01-06/researchers-show-male-stem-faculty-less-likely-to-support-research-showing-gender-bias.
[28] “Highlights of women’s earnings in 2015: BLS Reports: U.S. Bureau of Labor Statistics.” U.S. Bureau of Labor Statistics. November 2016. Accessed December 21, 2016. https://www.bls.gov/opub/reports/womens-earnings/2015/home.htm.
[29] National Women’s Law Center, “The Wage Gap is Stagnant in Last Decade,” September 2012; Center for American Progress, “The Wage Gap for Women,” August 16, 2012.
[30] “What is the gender pay gap and is it real?: The complete guide to how women are paid less than men and why it can’t be explained away.” Economic Policy Institute. Accessed January 17, 2017. http://www.epi.org/publication/what-is-the-gender-pay-gap-and-is-it-real/.
[31] http://www.thirdway.org/report/a-dollar-short-whats-holding-women-back-from-equal-pay
[32] U.S. Department of Labor, Bureau of Labor Statistics, Current Population Survey, Table 37, “Median weekly earnings of full-time wage and salary workers by selected characteristics,” 2015. http://www.bls.gov/cps/cpsaat37.htm.
[33]Ibid.
[34] U.S. Department of Labor, Bureau of Labor Statistics, Current Population Survey, Table 11, “Employed persons by detailed occupation, sex, race, and Hispanic or Latino ethnicity,” 2014; U.S. Department of Labor, Bureau of Labor Statistics, Current Population Survey, Table 39, “Median weekly earnings of full-time wage and salary workers by selected characteristics,” 2014. http://www.bls.gov/cps/cpsaat39.pdf.
[35] Author, Emily LinerEmail. “A Dollar Short: What’s Holding Women Back from Equal Pay?” Third Way. Accessed January 17, 2017. http://www.thirdway.org/report/a-dollar-short-whats-holding-women-back-from-equal-pay.
[36] Ibid.
[37] Ibid.
[38] Ibid.
[39] Miller , Claire Cain. “As Women Take Over a Male-Dominated Field, the Pay Drops.” The New York Times, March 18, 2016. https://www.nytimes.com/2016/03/20/upshot/as-women-take-over-a-male-dominated-field-the-pay-drops.html?_r=0.
[40] Ibid.
[41] Ibid.
[42] Ibid.
[43] Hirsch, Barry T. and David A. MacPherson. Union Membership and Earnings Data Book: Compilations from the Current Population Survey, 2016 edition.
[44] “Highlights of women’s earnings in 2015 : BLS Reports: U.S. Bureau of Labor Statistics.” U.S. Bureau of Labor Statistics. Accessed December 21, 2016. https://www.bls.gov/opub/reports/womens-earnings/2015/home.htm.
[45] Hallman, Linda D., “The Simple Truth about the Gender Pay Gap,” American Association of University Women, 2011. www.aauw.org/learn/research/upload/SimpleTruthAboutPayGap.pdf.
[46] Boushey, Heather, et. al., “Families Can’t Afford the Gender Wage Gap,” Center for American Progress, April 20, 2010. http://www.americanprogress.org/issues/2010/04/equal_pay.html.
[47] Ibid.
[48] Ibid.
[49] U.S. Department of Labor, Bureau of Labor Statistics, “Employment Characteristics of Families – 2016.”
[50] “Table 5. Employment status of the population by sex, marital status, and presence and age of own children under 18, 2014-2015 annual averages.” U.S. Bureau of Labor Statistics. April 22, 2016. Accessed January 09, 2017. https://www.bls.gov/news.release/famee.t05.htm#cps_fm_pchld.f.3.
[51] Grall, Timothy, “Custodial Mothers and Fathers and Their Child Support: 2013,” U.S. Department of Commerce, Bureau of the Census, January 2016. https://www.census.gov/content/dam/Census/library/publications/2016/demo/P60-255.pdf.
[52] U.S. Department of Commerce, Bureau of the Census, “Poverty Status in the Past 12 Months of Families,” 2015 American Community Survey 1-Year Estimates, S1702.
[53] Cited in: “Lifetime Losses: The Career Wage Gap,” Center for American Progress, January 6, 2009.
[54] Social Security is Important to Women. (2016, November). Retrieved from https://www.ssa.gov/news/press/factsheets/ss-customer/women-ret.pdf
[55] Ibid.
[56] Ibid.
[57] “Social Security Administration.” Importance of Income Sources Relative to Total Income. Accessed January 09, 2017. https://www.ssa.gov/policy/docs/statcomps/income_pop55/2014/sect08.html#table8.b2.
[58] Older Americans Key Indicators of Well-Being. Report. August 2, 2016. Accessed January 10, 2017. https://agingstats.gov/docs/LatestReport/Older-Americans-2016-Key-Indicators-of-WellBeing.pdf.
[59] Cited in: “Lifetime Losses: The Career Wage Gap,” Center for American Progress, January 6, 2009.
[60] Pay Secrecy and Wage Discrimination, Institute for Women’s Policy Research, January 2014.
[61] “Pay Secrecy Fact Sheet,” Women’s Bureau, U.S. Department of Labor, August 2015
[62] Ibid.
[63] Parents and High Cost of Childcare. Report. 2016. http://usa.childcareaware.org/wp-content/uploads/2016/12/CCA_High_Cost_Report.pdf.
[64] “How much does it cost to leave the workforce to care for a child? A lot more than you think.” PBS. June 21, 2016. Accessed January 26, 2017. http://www.pbs.org/newshour/making-sense/how-much-does-it-cost-to-leave-the-workforce-to-care-for-a-child-a-lot-more-than-you-think/.
[65] Parents and High Cost of Childcare. Report. 2016. http://usa.childcareaware.org/wp-content/uploads/2016/12/CCA_High_Cost_Report.pdf.
[66]Ibid.
[67] Ibid.
[68] Ibid.
[69] Ibid.
[70] Jamrisko, Michelle. “The Hidden Cost for Stay-At-Home American Parents.” Bloomberg.com. June 21, 2016. Accessed January 26, 2017. https://www.bloomberg.com/news/articles/2016-06-21/the-hidden-cost-for-stay-at-home-american-parents.
[71] “It’s time for an ambitious national investment in America’s children: Investments in early childhood care and education would have enormous benefits for children, families, society, and the economy.” Economic Policy Institute. April 6, 2016. Accessed January 11, 2017. http://www.epi.org/publication/its-time-for-an-ambitious-national-investment-in-americas-children/#epi-toc-7.
[72] Ibid.
[73] Livingston, Gretchen. “Among 41 nations, U.S. is the outlier when it comes to paid parental leave.” Pew Research Center. September 26, 2016. Accessed January 11, 2017. http://www.pewresearch.org/fact-tank/2016/09/26/u-s-lacks-mandated-paid-parental-leave/.
[74] “Rutgers Study Finds Paid Family Leave Leads to Positive Economic Outcomes.” Rutgers Study Finds Paid Family Leave Leads to Positive Economic Outcomes | Media Relations. January 19, 2012. Accessed January 26, 2017. http://news.rutgers.edu/news-releases/2012/01/rutgers-study-finds-20120118#.WIpqwVMrJQJ.
[75] “US: Lack of Paid Leave Harms Workers, Children.” Human Rights Watch. February 24, 2012. Accessed January 27, 2017. https://www.hrw.org/news/2011/02/23/us-lack-paid-leave-harms-workers-children.
[76] “For how long are workers guaranteed paid sick leave?” WORLD Policy Analysis Center. Accessed January 11, 2017. http://www.worldpolicycenter.org/policies/for-how-long-are-workers-guaranteed-paid-sick-leave.
[77] “The need for paid sick days: The lack of a federal policy further erodes family economic security.” Economic Policy Institute. June 29, 2011. Accessed January 27, 2017. http://www.epi.org/publication/the_need_for_paid_sick_days/.
[78] Ibid.
[79] Ibid.
[80] Ibid.
[81] “Additional leave entitlements for working parents.” OECD. January 12, 2016. Accessed January 11, 2017. https://www.oecd.org/els/soc/PF2_3_Additional_leave_entitlements_of_working_parents.pdf.
[82] Schulte, Brigid. “Women need time off from work the most but often get it the least.” The Washington Post, February 25, 2015. https://www.washingtonpost.com/news/wonk/wp/2015/02/25/women-need-time-off-from-work-the-most-but-often-get-it-the-least/?utm_term=.3e953ed5e832.
[83] Ibid.
[84] U.S. Department of Labor, Bureau of Labor Statistics, “Union Members Summary- 2014,” Economic News Release. January 28, 2016.
[85] “Table 1. Union affiliation of employed wage and salary workers by selected characteristics.” U.S. Bureau of Labor Statistics. Accessed January 11, 2017. https://www.bls.gov/news.release/union2.t01.htm.
[86] Hirsch, Barry T. and David A. Macpherson, Union Membership and Earnings Data Book: Compilations from the Current Population Survey, The Bureau of National Affairs, Inc, 1997 Edition.
[87] “The Union Advantage for Women.” Institute for Women’s Policy Research, August 2015.
[88] Hirsch, Barry T. and David A. MacPherson. Union Membership and Earnings Data Book: Compilations from the Current Population Survey, 2016 edition.
[89] U.S. Census Bureau, DataFerrett, American Community Survey, Public Use Microdata Sample, 2016.
[90] Hirsch, Barry T. and David A. MacPherson. Union Membership and Earnings Data Book: Compilations from the Current Population Survey, 2016 edition.
[91] U.S. Census Bureau, DataFerrett, American Community Survey, Public Use Microdata Sample, 2016.
[92] Bronfenbrenner, Kate and Robert Hickey, “Changing to Organize: A National Assessment of Union Organizing Strategies,” in Ruth Milkman and Kim Voss, eds., Organize or Die: Labor’s Prospects in Neoliberal America, (Ithaca, NY: Cornell University Press, 2004); Kate Bronfenbrenner, “Organizing Women: The Nature and Process of Union Organizing Efforts among U.S. Women Workers since around the Mid-1990’s,” Work and Occupations, 32, 4, November 2005.
[93] U.S. Department of Labor, Bureau of Labor Statistics, Table 2, “Median Weekly Earnings of Full Time Wage and Salary Workers by union affiliation and selected characteristics, 2015 annual averages” http://www.bls.gov/news.release/union2.t02.htm.
[94] Ibid.
[95] “IWPR Publication.” San Francisco’s Paid Sick Leave Ordinance: Outcomes for Employers and Employees — IWPR. February 2011. Accessed January 27, 2017. http://www.iwpr.org/publications/pubs/San-Fran-PSD.
[96] “Fact Sheet: The Healthy Families Act.” National Partnership for Women and Families. 2015. http://www.nationalpartnership.org/research-library/work-family/psd/the-healthy-families-act-fact-sheet.pdf.
[97] Ibid.
[98] “Current Sick Days Laws.” National Partnership for Women and Families. Accessed January 30, 2017. http://www.paidsickdays.org/research-resources/current-sick-days-laws.html.
[99] “Latest Research.” National Partnership for Women and Families. Accessed January 30, 2017. http://www.paidsickdays.org/research-resources/latest-research.html#.WI-Cd1MrJQI.
[100] Expanding Access to Paid Sick Leave: The Impact of the Healthy Families Act on America’s Workers. March 2010. http://www.jec.senate.gov/public/_cache/files/abf8aca7-6b94-4152-b720-2d8d04b81ed6/sickleavereportfinal.pdf.
[101] “Paid Leave.” A Better Balance. Accessed January 31, 2017. http://www.abetterbalance.org/our-campaigns/paid-family-leave/.
[102] Miller, Claire Cain . “The Economic Benefits of Paid Parental Leave.” The New York Times, January 30, 2015. https://www.nytimes.com/2015/02/01/upshot/the-economic-benefits-of-paid-parental-leave.html?_r=0.
[103] Ibid.
[104] Ibid.
[105] Ibid.
[106] Chokshi, Niraj. “What paid family leave looks like in the three states that offer it.” Washington Post. https://www.washingtonpost.com/blogs/govbeat/wp/2014/06/24/what-paid-family-leave-looks-like-in-the-three-states-that-require-it/?utm_term=.161d295b4948.
[107] “It’s time for an ambitious national investment in America’s children: Investments in early childhood care and education would have enormous benefits for children, families, society, and the economy.” Economic Policy Institute. April 6, 2016. Accessed January 31, 2017. http://www.epi.org/publication/its-time-for-an-ambitious-national-investment-in-americas-children/.
[108] Ibid.
[109] High-Quality, Affordable Childcare for All: Good for Families, Communities, and the Economy. Report. May 6, 2016. http://www.policylink.org/sites/default/files/Childcare-for-All-FINAL-05-06-16.pdf.
[110] Ibid.
[111] Kaitlin Holmes, Jocelyn Frye, Sarah Jane Glynn, and Jessica Quinter. “Rhetoric vs. Reality: Equal Pay.” Center for American Progress. November 7, 2016. Accessed February 01, 2017.
[112] Frye, Jocelyn. “Next Steps for Progress on Equal Pay.” Center for American Progress. April 12, 2016. Accessed February 01, 2017. https://www.americanprogress.org/issues/women/reports/2016/04/12/135267/next-steps-for-progress-on-equal-pay/.
[113] Executive Summary: 50 Years & Counting: The Unfinished Business of Achieving Fair Pay. Report. June 10, 2003. http://nwlc.org/wp-content/uploads/2015/08/final_nwlc_equalpayexecutivesummary.pdf.
[114] Kaitlin Holmes, Jocelyn Frye, Sarah Jane Glynn, and Jessica Quinter. “Rhetoric vs. Reality: Equal Pay.” Center for American Progress. November 7, 2016. Accessed February 01, 2017. https://www.americanprogress.org/issues/women/reports/2016/11/07/292175/rhetoric-vs-reality-equal-pay/.
[115] “How the Paycheck Fairness Act Will Strengthen the Equal Pay Act.” NWLC. 2015. Accessed January 31, 2017. https://nwlc.org/resources/how-paycheck-fairness-act-will-strengthen-equal-pay-act
Professionals in the Contingent Workforce
2016 Fact Sheet
This fact sheet examines the segment of the professional workforce engaged in contingent or alternative work arrangements, referred to collectively as contingent work. In 2015, there were over 9.2 million self-employed and temporary workers employed in management, professional, and related occupations according to data from the Census Bureau. Special attention will be paid to arts, design, entertainment, sports, and media occupations where over 30 percent of the workforce is self-employed. The fact sheet will also examine issues facing adjunct faculty as well as assess the challenges facing the contingent workforce.
The absence of specific government data on the contingent workforce is a significant limitation when researching the professional contingent workforce. The U.S. Census Bureau, through the Current Population Survey (CPS), released a regular supplemental survey on the contingent workforce, but the supplement was discontinued in 2005. To evaluate the contingent workforce, this fact sheet relies on CPS self-employment data, non-governmental surveys of the independent workforce, the CPS contingent workforce supplements, and industry employment data.
Defining the Contingent Workforce
A standard work arrangement is one in which a person works full-time or part-time for one employer for an indefinite period of time. Contingent workers are employed in non-permanent positions as independent contractors, temporary workers, contract workers, on-call workers, consultants, freelancers, or are self-employed. The U.S. Bureau of Labor Statistics (BLS) defines contingent work as work where no implicit or explicit agreement exists for the work to continue, typically beyond one year. However, the CPS contingent worker supplement was the last survey that tracked work by its duration. Thus, this fact sheet focuses on non-permanent employment without regard to duration.
The contingent workforce includes:
1. Self-Employed and Independent Contractors
The distinction between a person who is self-employed and one that is an independent contractor can be confusing. Generally, if a person is an independent contractor, then they are self-employed, but an independent contractor is not always self-employed.[1] For example, a graphic designer that works from her home and designs reports and publications for companies is an independent contractor and self-employed. But a doctor who examines a patient is self-employed and not an independent contractor
2. Temporary (or Temp) Workers
Temp workers are employed, and paid, by a temporary help services agency that assigns them to employers upon request. The temporary help services industry falls within the employment services industry and accounts for a majority (80 percent) of the employment services industry. Detailed data is available for the employment services industry, but only workforce totals are available for the temporary help services industry.
3. On-Call Workers
Employed on an on-call basis, these workers report to work when needed. The CPS contingent worker survey tracked these workers until the survey was discontinued in 2005. There is no known survey that currently tracks on-call workers. However, U.S. Secretary of Labor Tom Perez announced in January 2016 that the contingent worker survey would be reinstated and expected release of new data in May 2017.
4. Contracted Employment (Workers Provided by Contract Firms)
Contracted employment describes workers who are employed by an employer that contracts out the employee’s services to another employer. These workers usually work at a job site that is not the location of the principle employer. The CPS survey tracked these workers until the survey was discontinued in 2005.
5. Short-Term Contract Workers
Many workers are employed directly by the employer, but under a short or long-term contract. Thus, employment is set to end on a specific date, or after the terms of the contract are fulfilled. Since there is no available data to quantify this segment of the contingent workforce, the fact sheet will discuss the example of adjunct faculty.
The Changing Contingent Workforce
Capturing a complete picture of the alternative workforce is challenging since the discontinuation of the CPS contingent worker survey. However, good data exists on self-employed and temp workers. In the case of self-employed workers, the contingent worker survey took steps that this fact sheet does not to exclude self-employed workers who were business operators. This fact sheet will review the 2005 data on workers provided by contract firms as well as on-call workers. Finally, the case of adjunct faculty will be explored to highlight the increased use of short-term contract workers.
The Self-Employed Workforce
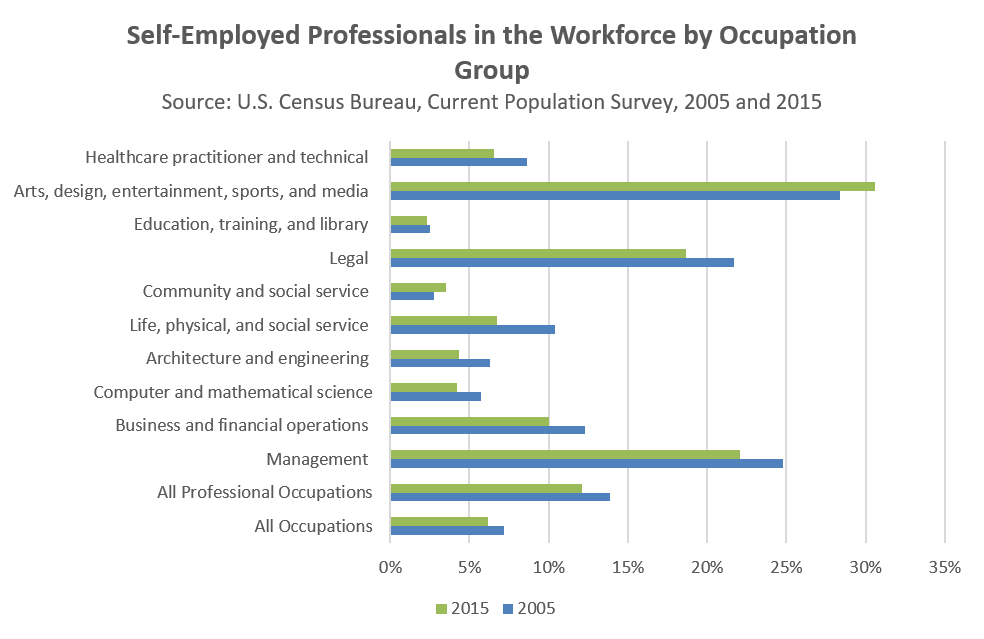
In 2015, there were just over 15.4 million workers in the U.S. who reported being self-employed in their main job; 46 percent of them worked in management, professional, and related occupations (7.2 million self-employed professional workers). Overall, 12 percent of the management, professional, and related U.S. workforce was self-employed in 2015. Another nearly 342,631 workers reported being self-employed in a second job; 50 percent were self-employed in management, professional, or related occupations.
Among the management, professional, and related occupational groupings[a], three had a concentration of self-employed workers that was well above the national average: management occupations[b] (22 percent self-employed); legal occupations[c] (19 percent); and arts, design, entertainment, sports, and media occupations (31 percent self-employed). All other management, professional, and related occupation groups had a concentration of self-employed workers that was between two and 10 percent.
The self-employed professional and technical workforce declined by four percent between 2005 and 2015. At the same time, employees (all those not self-employed) in the professional and technical workforce grew by 20 percent.[2] The number of professionals who were self-employed and incorporated increased by nearly 300,000. Self-employed professionals who were unincorporated declined by nearly 100,000. Only arts and media and community and social service professionals who were self-employed and unincorporated saw an increase in employment.
Self-Employment in Arts, Design, Entertainment, Sports, and Media Occupations
The arts, design, entertainment, sports, and media (arts and media) occupation group includes designers, athletes, musicians, announcers, news analysts, and photographers among others. There are 18 occupations in the broad arts and media occupational category and 12 of those occupations saw an increase in the concentration of self-employed workers from 2005 to 2015.[3]
From 2005 to 2015, among all workers in arts and media occupations, employment grew by 11 percent. Self-employment in arts and media occupations grew by 17 percent during the same period. The concentration of self-employed workers in all arts and media occupations grew from 28 percent in 2005 to 31 percent in 2015. However, 12 out of the 18 arts and media occupations saw increases between one and 14 percent in the concentration of self-employed workers in the particular occupation.[4]
The demographics of the self-employed arts and media workforce shows that they are older than traditional arts and media workers, majority male and well educated.
The arts and media self-employed workforce, in July 2016, averaged 48 years of age; workers who were not self-employed in the traditional arts and media workforce averaged 38 years of age. The average age among all workers in arts and media occupations was 41.[5]
The arts and media workforce was 47 percent female in July 2016. A nearly equal percentage of women were self-employed in the arts and media workforce.[6]
Self-employed workers in arts and media occupations had slightly higher education attainment than workers who were not self-employed in arts and media occupations. Among the non-self-employed, 59 percent had a bachelor’s degree or higher and among self-employed workers, 64 percent had earned a bachelor’s degree or higher by July 2016.[7]
On average, 31 percent of the arts and media workforce was self-employed. Two out of the four regions in the U.S. had a higher concentration of self-employed workers, including the West (34 percent) and the Northeast (32 percent self-employment).[8]
No research exists to explain the growth of self-employment in arts and media occupations. Multiple explanations are possible. Since the self-employed arts and media workforce is older than traditional arts and media workers, these older workers may be seeking freedom from the traditional 9 to 5 schedule and seek out self-employment by choice.
Alternatively, employers could be driving the growth of the self-employed workforce by awarding more work to independent contractors in an effort to save money. As discussed below, employers can save 20-40 percent by hiring an independent contractor instead of a traditional employee. In fact, even though self-employed workers in arts and media occupations are older and more educated than traditional workers and should be earning more money, in 2014, average earnings for a self-employed worker in an arts and media occupation was $45,533, compared to $47,365 for non-self-employed arts and media workers.[9] If cost savings are the driving force behind the shift, then it may be difficult for employers to access a skilled workforce because the lower pay may drive experienced workers out of the field and deter new workers from entering the field.
Temporary Workers
According to BLS, the temporary help services industry employed 2,891,400 workers in May 2016.[10] The temp industry grew by 40 percent between May 2010 and May 2016, adding nearly 830,000 jobs. This growth accounted for six percent of all job growth in the U.S. from May 2010 to May 2016.[11]
Temporary help workers are paid by a temp agency, but perform work at an employer’s worksite. The flexible nature of these working arrangements has meant that many workers are hired when the U.S. economy is expanding, but steep job losses result during economic contraction.[12]
The temporary help services industry grew nine percent between 2006 and 2016.[13] However, as noted above, the industry is susceptible to sharp downturns. For example, from 2007 to 2009, employment in temporary help services declined by nearly 780,000 jobs or 30 percent.[14]

The temporary help services industry falls within the employment services industry. Temporary help services accounted for about 80.3 percent of employment within the employment services industry in 2015. Professional and technical workers made up 18 percent (about 672,000 workers) of the employment services industry workforce. The professional and technical occupation group with the greatest number of workers was business and financial occupations with 164,270 employed in 2015.

Substitute teachers (48,010) made up the majority of education, training, and library workers in the employment services industry in 2015. Human resources specialists accounted for 52 percent of all business and financial operations occupations in 2015. Within healthcare practitioner and technical occupations in 2015, most workers in the employment services industry were nurses (48,070 RNs and 27,595 LPNs).[15]
Recent research and media reports have raised concerns about temporary workers in healthcare occupations. A 2011 Johns Hopkins Medicine study found that “Temporary staff members working in a hospital’s fast-paced emergency department are twice as likely as permanent employees to be involved in medication errors that harm patients.” While temporary healthcare workers, like doctors and nurses, are considered a cheap alternative to permanent staff, the study concluded that there is great risk to patient safety.[16]
An investigation by ProPublica and the Los Angeles Times in 2009 “found dozens of instances in which staffing agencies skimped on background checks or ignored warnings from hospitals about sub-par nurses on their payrolls. Some hired nurses sight unseen, without even conducting an interview. As a result, fill-in nurses with documented histories of poor care have fallen asleep on the job, failed to perform critical tests or stolen drugs intended to ease patients’ pain or anxiety.”[17] These troubling reports of abuse could explain why there has been a decline in employment of temporary healthcare workers in the last 10 years.
On-Call Workers
In February 2005, the last year a survey of on-call workers was conducted, there were 2,453,623 on-call workers in the U.S. Professional and technical on-call workers were 36 percent of the on-call workforce. Nearly 45 percent (388,360) worked in education, training, and library occupations. Another 21 percent of on-call workers worked in healthcare practitioner and technical occupations.[18]
Because the contingent workers survey was discontinued, it is difficult to estimate the size of the on-call workforce after 2005. A 2015 study, which conducted a version of the contingent worker survey, estimated the on-call workforce to be 2.6 percent of employed persons in 2015 or about 3,884,400 workers.[19]
Workers Provided by Contract Companies
In February 2005, there were 813,000 workers provided by contract firms. Nearly 40 percent were in management, professional, and related occupations. Most were employed in the education and health services industry.[20] The 2015 survey estimated that 3.1 percent of workers were provided by contract firms. This amounted to about 4,631,400 workers in the 2015 period of study.[21]
Adjunct Faculty in the Contingent Workforce
Contingent employment has long been on the rise among adjunct faculty in American colleges and universities. Estimates placed the size of the adjunct workforce at 1.4 million in the fall of 2011, or about 76 percent of all instructional staff.[22] Many adjuncts are employees of the college or university, but on a short-term or contract basis. Adjuncts may have an implied or explicit contract to teach one or more semesters for a college or university, but the adjunct has little job security and most lack access to retirement or health benefits.[23]
Historically, full-time tenure or tenure-track faculty made up a large percentage of college and university faculty. This faculty was well paid, had access to pension and health benefits, and had the academic freedom to apply rigor in the classroom. Typically, full-time faculty teach two to six courses per year.[24] In 1975, 45 percent of college and university teachers were full-time tenured or tenure-track faculty.[25] In 2013, just 27 percent were full-time tenured or tenure track and 73 percent of postsecondary faculty were ineligible for tenure by 2013.[26]
Most part-time faculty want full-time work. A June 2012 survey of part-time adjunct faculty found that nearly 75 percent of respondents were looking for full-time tenure-track positions or would accept a full-time tenure-track position with their current college or university employer.[27] While the cohort was characterized as “part-time faculty,” nearly 30 percent of respondents reported teaching three or more courses in a semester.[28]
Most of the surveyed part-time contingent faculty had earned at least a master’s degree (40 percent) and 30 percent reported earning a doctorate, yet part-time faculty compensation is not commensurate with experience and education. Among respondents of the part-time faculty survey, the median pay per course was $2,700. Part-time faculty are estimated to teach eight courses per year, which is far more than most full-time faculty teach.[29] Most adjuncts are stuck in an endless cycle of short-term work: “over 80% of respondents reported teaching part-time for more than three years, and over half for more than six years.”[30]
In response to low wages, lack of benefits, and absence of institutional support, many adjuncts are turning to the collective power of unions.[31] Among the surveyed part-time faculty, unions have made a difference. Adjuncts who are represented by unions earn a median pay per course of $3,100 compared to $2,475 for non-union.[32] Among part-time adjuncts at institutions where a union is present, 30 percent have health benefits that are either entirely paid by the employer or the cost is shared by the employer and employee. Where there is no union present, just 11 percent had access to health benefits through their employer. In the case of retirement benefits, 49 percent of part-time adjuncts who taught where a union was present had retirement benefits that were fully or partially paid by the employer, compared to 20 percent of adjuncts at institutions where no union was present.[33]
Contingent Workforce Size Estimates
Numerous studies have released estimates in an attempt to quantify the contingent workforce. Independent surveys define the contingent workforce differently with some surveys including standard part-time workers who are employees and not independent contractors or self-employed.
In 2005, the CPS contingent worker supplement estimated the contingent workforce to be 14.8 million.[34] The CPS estimate includes independent contractors, on-call workers, temporary help agency workers, and workers provided by contract firms. The research for this fact sheet found that in 2015, there were nearly 21.6 million self-employed and temporary workers in the U.S. Among those, 9.2 million worked in management, professional, and related occupations.
In November 2015, economists Lawrence Katz and Alan Krueger conducted a version of the CPS contingent worker supplement as part of the RAND Corporation American Life Panel. Their findings showed that the percentage of workers engaged in alternative work arrangements (defined as temporary help agency workers, on-call workers, contract workers, and independent contractors – the same definitions used by the CPS supplement) rose from 10.1 percent in 2005 to 15.8 percent in 2015. This represents an addition of 9.4 million workers engaged in alternative work arrangements over a ten year period.[35]
The Freelancers Union, an organization that “promotes the interests of independent workers through advocacy, education, and services,” estimates that there are 54 million contingent workers in the U.S. (or about a third of the workforce). The Freelancers Union defines the contingent workforce to include contract company workers, agency temps, on-call workers/day laborers, direct-hire temps, self-employed workers, independent contractors, and standard part-time workers.[36]
A survey by MBO Partners, estimated that there were 16.9 million full-time contingent workers in the U.S. in 2015, 900,000 fewer than there were in 2013.[37] The survey also estimated that there were an additional 12.4 million part-time independent workers. MBO Partners defined contingent workers “as people who work at least 15+ hours per week in non-traditional, non-permanent full or part-time employment and includes workers who identify themselves as consultants, freelancers, contractors, self-employed, and on-call workers, among others.”[38] Survey responses were gathered from online survey, which may affect reliability since the respondents appear to be self-selected and require internet access or an email address.
The Online “Gig Economy”
In recent years, the number of contingent workers who are part of the “online gig economy” – where online technology is used to contract workers for specific, on-demand services – has increased. Estimates for how many workers are involved in this segment of the economy vary widely depending on the method used for measuring this rapidly changing workforce. A 2015 discussion paper by the Hamilton Project estimated 0.4 percent of total U.S. employment was earning money in the “gig economy” based on an analysis of Google search terms related to online intermediaries.[39] The modified contingent worker supplement survey conducted by Katz and Krueger found 0.5 percent of the U.S. workforce to be part of the “gig economy.”[40] Other estimates put the figure much higher. The McKinsey Global Institute estimated as much as one percent of the U.S. workforce is part of the online “gig economy” in 2015.[41]
Long-Term Challenges Facing the Contingent Workforce
One of the advantages often cited by employers as a reason to hire independent workers is the cost savings. Cost savings for employers include not having to contribute to Social Security, unemployment insurance, or Medicare; provide health insurance; or pay toward a retirement benefit. The savings to employers for hiring independent workers can be as much as 20 to 40 percent according to one estimate.[42] However, this is a cost that must be borne by the worker and many choose to forgo retirement and health insurance.
Retirement and Pension Plan Coverage
Self-employed workers are responsible for funding their own retirement plan. Since self-employed and independent contractors do not have a traditional employer/employee work arrangement, they do not receive contribution toward a pension. Self-employed workers are more likely than traditional full-time workers to have an individual retirement account or Keogh plan.
The 2005 contingent worker supplement showed that 51 percent of contingent workers in management, professional, and related occupations had a pension plan or individual retirement plan/Keogh plan.[43] In 2014, among all management, professional, and related workers, 83 percent had access to a retirement plan (71 percent actually participated).[44]
Health Insurance
Access to affordable health insurance is a persistent problem for contingent workers. The passage of the Affordable Care Act removes the access barrier, but for a workforce that can face inconsistent employment, the affordability of health insurance remains a concern.
Among self-employed workers in management, professional, and related occupations in 2014, 12 percent did not have health insurance coverage. Just six percent of traditionally employed workers in management, professional, and related occupations were without health insurance coverage in 2014.[45] Among self-employed non-professional workers, 26 percent lacked health insurance while 19 percent of non-professional workers lacked insurance overall. [46]
Worker Protections
Many workplace laws designed to protect employees, are not applicable to the self-employed or independent contractors. Important protections that may not be applicable, even though a contingent worker is located at an employer’s worksite include: the Family and Medical Leave Act; the Employee Retirement Income Security Act; the Fair Labor Standards Act, which established minimum wage, overtime, and child labor laws; and the National Labor Relations Act, which established the right to organize a union and bargain collectively. Self-employed workers and independent contractors who are properly classified as such are not eligible for workers’ compensation or unemployment insurance.[47]
Conclusion
Growth in the professional contingent workforce is largely driven by temporary workers, workers on short-term contracts, like adjuncts, and self-employed workers in some arts and media occupations. For some of these workers, contingent employment means creative freedom and control over their schedule. For others, contingent employment has meant limited access to health and retirement benefits and inconsistent employment. Many adjuncts have fought the workplace imbalance through the collective power of unions and have achieved gains.
Related reading:
The Union Difference for Working Professionals
I'm a Professional. What can a union do for me?
August 2016
[a] Defined by the U.S. Bureau and Labor Statistics to include management; business and financial operations; computer and mathematical; architecture and engineering; life, physical, and social science; community and social service; legal; education, training, and library; arts, design, entertainment, sports and media; and healthcare practitioners and technical. This author also uses “professional and technical occupations” to refer to the same occupational grouping.
[b] Management occupations include: chief executives; general and operations managers; public relations and fundraising managers; lodging managers; purchasing managers; farmers, ranchers, and other agricultural managers; and construction managers.
[c] Self-employment is high in legal occupations, because many lawyers start their own law firms.
[1] Internal Revenue Service, Independent Contractor Defined. http://www.irs.gov/Businesses/Small-Businesses-%26-Self-Employed/Independent-Contractor-Defined
[2] U.S. Census Bureau, DataFerrett, Current Population Survey, Basic Monthly Microdata, Annual Averages 2005 and 2015
[3]Ibid.
[4] Ibid.
[5] U.S. Census Bureau, DataFerrett, Current Population Survey, Basic Monthly Microdata, July 2016.
[6] Ibid.
[7] Ibid.
[8] U.S. Census Bureau, DataFerrett, Current Population Survey, Basic Monthly Microdata, 2015 Annual Average.
[9] U.S. Census Bureau, DataFerrett, American Community Survey, Public Use Microdata Sample, 2014.
[10] U.S. Bureau of Labor Statistics, Databases, Tables & Calculators by Subject, Employment, Hours and Earnings from the Current Employment Statistics survey, Temporary help services industry. http://data.bls.gov/timeseries/CES6056132001
[11] U.S. Bureau of Labor Statistics, Current Employment Statistics, CES Databases, All employees, not seasonally adjusted, 2006 - 2016.
[12] Tian Luo, Amar Mann, and Richard Holden, “The expanding role of temporary help services from 1990 to 2008.” Monthly Labor Review, August 2010.
[13] U.S. Bureau of Labor Statistics, Current Employment Statistics, CES Databases, All employees, not seasonally adjusted, Temporary Help Services, December 2015.
[14] Ibid.
[15] U.S. Bureau of Labor Statistics, Occupational Employment Statistics, National Industry-Specific Occupation Employment and Wage Estimates, May 2005 and 2015
[16] Johns Hopkins Medicine. “Temporary ER Staff Poses Increased Safety Risk to Patients.” News Release. August 25, 2011. Available at: http://www.hopkinsmedicine.org/news/media/releases/temporary_er_staff_poses_increased_safety_risk_to_patients
[17] Weber, Tracy and Charles Ornstein, “Temp Firms a Magnet for Unfit Nurses.” ProPublica. December 5, 2009. Available at: http://www.propublica.org/article/temporary-nurses-danger-inadequate-oversight-1206
[18] U.S. Census Bureau, DataFerrett, Current Population Survey, Contingent Worker Supplement, February 2005.
[19] Katz, Lawrence and Alan Krueger. “The Rise of Alternative Work Arrangements in the United States, 1995-2015”. National Bureau of Economic Research. March 29, 2016.
[20] U.S. Bureau of Labor Statistics, News, Contingent and Alternative Employment Arrangements, February 2005.
[21] Katz, Lawrence and Alan Krueger. “The Rise of Alternative Work Arrangements in the United States, 1995-2015”. National Bureau of Economic Research. March 29, 2016.
[22] Curtis, John W, “The Employment Status of Instructional Staff Members in Higher Education, Fall 2011,” American Association of University Professors, April 2014.
[23] Flaherty, Colleen, “Making the Case for Adjuncts.” Inside Higher Ed. January 9, 2013. Available at: http://www.insidehighered.com/news/2013/01/09/adjunct-leaders-consider-strategies-force-change
[24] The Coalition on the Academic Workforce, “A Portrait of Part-Time Faculty Members.” June 2012.
[25] “The Employment Status of Instructional Staff Members in Higher Education, Fall 2011”
[26] American Association of University Professors, Instructional Faculty by Rank and Reporting Category, 2013 (pdf). A figure from the 2014-15 Annual Report on the Economic Status of the Profession. Available at: https://www.aaup.org/sites/default/files/files/2015salarysurvey/Fig4.pdf
[27] The Coalition on the Academic Workforce. June 2012.
[28] Ibid.
[29] Ibid.
[30] Ibid.
[31] See Snyder, Susan, “A union push to organize Philly-area college adjuncts.” Philly.com. December 16, 2013.
[32] The Coalition on the Academic Workforce, Table 25.
[33] Ibid. Table 36 and 37.
[34] U.S. Department of Labor, Bureau of Labor Statistics, “Contingent and Alternative Employment Arrangements,” News Release, July 27, 2005.
[35] Katz, Lawrence and Alan Krueger. “The Rise of Alternative Work Arrangements in the United States, 1995-2015”. National Bureau of Economic Research. March 29, 2016.
[36] Horowitz, Sara, and Fabio Rosati. 2015. “Freelancing in America: A National Survey of the New Workforce.” Freelancers Union & Upwork.
[37] MBO Partners, “The State of Independence in America: Sixth Annual Independent Workforce Report,” September 2016.
[38] Ibid.
[39] Harris, Seth D. and Alan B. Krueger. “A Proposal for Modernizing Labor Laws for Twenty-First-Century Work: The ‘Independent Worker’”. The Hamilton Project. December 2015.
[40] Katz, Lawrence and Alan Krueger. “The Rise of Alternative Work Arrangements in the United States, 1995-2015”. National Bureau of Economic Research. March 29, 2016.
[41] McKinsey Global Institute. 2015, June. “Connecting Talent with Opportunity in the Digital Age.” Retrieved from: http://www.mckinsey.com/global-themes/employment-and-growth/connecting-talent-with-opportunity-in-the-digital-age
[42] Steven Cohen and William B. Eimicke, “Independent Contracting, Policy Management Analysis.” New York City, August 2013.
[43] U.S. Census Bureau, DataFerrett, Current Population Survey, Contingent Worker Supplement, February 2005.
[44] U.S. Bureau of Labor Statistics, “Employee Benefits in the United States,” BLS News Release, July 24, 2015. Available at: http://www.bls.gov/news.release/pdf/ebs2.pdf
[45] U.S. Census Bureau, DataFerrett, American Community Survey, Public Use Microdata, 2014.
[46] Ibid.
[47] United States Government Accountability Office, “Employment Arrangements: Improved Outreach Could Help Ensure Proper Worker Classification.” GAO-06-656. July 2006.
Recourse for Employees Misclassified as Independent Contractors
2016 Fact Sheet
Misclassification as an independent contractor has several consequences that affect governments and workers. Employers who misclassify employees are failing to provide unemployment insurance (UI) and workers’ compensation (WC) as well as failing to pay employer withholding taxes—leaving workers with large tax bills.
Employees who believe they have been misclassified as independent contractors have several avenues for resolution. These suggestions are not intended to substitute for legal advice, nor are they intended to be an exhaustive list of available options or remedies.
First, workers can contact their state departments of revenue and labor to report suspected misclassification, including UI, WC, and tax fraud. Many states give workers the option of anonymously reporting employers who are erroneously misclassifying employees as independent contractors. Click here for a complete list of state resources for UI, WC, and tax fraud reporting.
Second, if the employer has misclassified the worker as an independent contractor and paid less than minimum wage or failed to pay overtime, then the worker can contact the U.S. Department of Labor Wage and Hour Division to report minimum wage and overtime pay violations.
Third, workers can anonymously report suspected tax fraud (employer failure to withhold taxes) to the Internal Revenue Service (IRS) by using Form 3949-A. Workers can also file Form SS-8 with the IRS for a determination of worker status. Form SS-8 CANNOT be filed anonymously.
Finally, workers always have the option of seeking legal counsel.
August 2016
The U.S. Health Care System: An International Perspective
2016 Fact Sheet
The U.S. health care system is unique among advanced industrialized countries. The U.S. does not have a uniform health system, has no universal health care coverage, and only recently enacted legislation mandating healthcare coverage for almost everyone. Rather than operating a national health service, a single-payer national health insurance system, or a multi-payer universal health insurance fund, the U.S. health care system can best be described as a hybrid system. In 2014, 48 percent of U.S. health care spending came from private funds, with 28 percent coming from households and 20 percent coming from private businesses. The federal government accounted for 28 percent of spending while state and local governments accounted for 17 percent.[1] Most health care, even if publicly financed, is delivered privately.
In 2014, 283.2 million people in the U.S., 89.6 percent of the U.S. population had some type of health insurance, with 66 percent of workers covered by a private health insurance plan. Among the insured, 115.4 million people, 36.5 percent of the population, received coverage through the U.S. government in 2014 through Medicare (50.5 million), Medicaid (61.65 million), and/or Veterans Administration or other military care (14.14 million) (people may be covered by more than one government plan). In 2014, nearly 32.9 million people in the U.S. had no health insurance.[2]
This fact sheet will compare the U.S. health care system to other advanced industrialized nations, with a focus on the problems of high health care costs and disparities in insurance coverage in the U.S. It will then outline some common methods used in other countries to lower health care costs, examine the German health care system as a model for non-centralized universal care, and put the quality of U.S. health care in an international context.
In Comparison to Other OECD Countries
The Organization for Economic Co-operation and Development (OECD) is an international forum committed to global development that brings together 34 member countries to compare and discuss government policy in order to “promote policies that will improve the economic and social well-being of people around the world.”[3] The OECD countries are generally advanced or emerging economies. Of the member states, the U.S. and Mexican governments play the smallest role in overall financing of health care.[4] However, public (i.e. government) spending on health care per capita in the U.S. is greater than all other OECD countries, except Norway and the Netherlands.[5]
This seeming anomaly is attributable, in part, to the high cost of health care in the U.S. Indeed, the U.S. spends considerably more on health care than any other OECD country.
The OECD found that in 2013, the U.S. spent $8,713 per person or 16.4 percent of its GDP on health care—far higher than the OECD average of 8.9 percent per person.[6] Following the U.S. were the Netherlands, which allocated 11.1 percent of its GDP, then Switzerland also at 11.1 percent, and Sweden, which allocated 11 percent of its GDP to health care in 2013. In North America, Canada and Mexico spent respectively 10.2 percent and 6.2 percent of their GDP on health care.
On a per capita basis, the U.S. spends more than double the $3,453 average of all OECD countries (see chart[7] below).[8]
Health Expenditure per capita, 2013 (or nearest year)
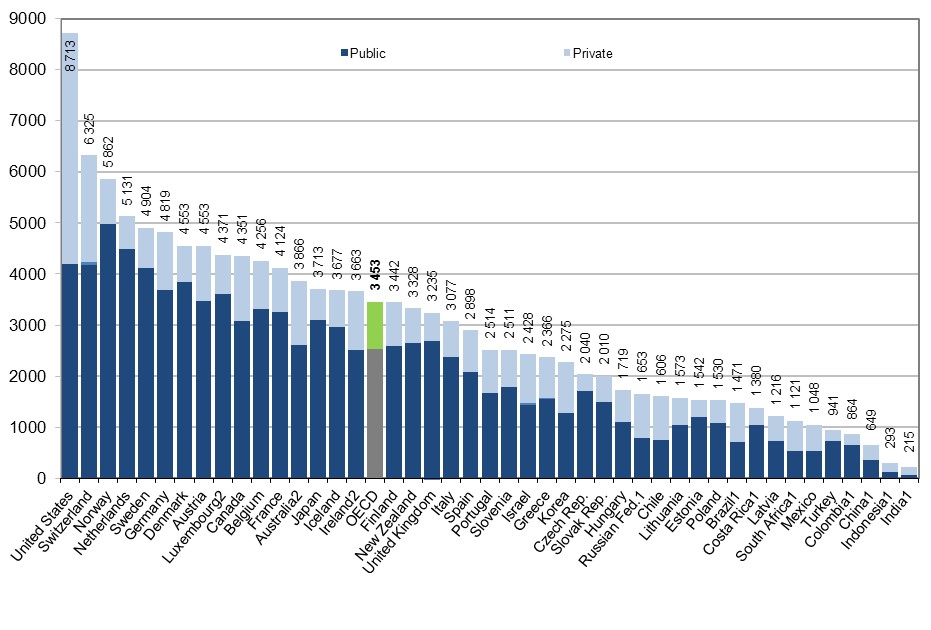
Drivers of Health Care Spending in the U.S.
Prohibitively high cost is the primary reason Americans give for problems accessing health care. Americans with below-average incomes are much more likely than their counterparts in other countries to report not: visiting a physician when sick; getting a recommended test, treatment, or follow-up care; filling a prescription; and seeing a dentist.[9] Fifty-nine percent of physicians in the U.S. acknowledge their patients have difficulty paying for care.[10] In 2013, 31 percent of uninsured adults reported not getting or delaying medical care because of cost, compared to five percent of privately insured adults and 27 percent of those on public insurance, including Medicaid/CHIP and Medicare.[11]
While there is no agreement as to the single cause of rising U.S. health care costs, experts have identified three contributing factors. The first is the cost of new technologies and prescription drugs. Some analysts have argued “that the availability of more expensive, state-of-the-art medical technologies and drugs fuels health care spending for development costs and because they generate demand for more intense, costly services even if they are not necessarily cost-effective.”[12]In 2013, the U.S. spent $1,026 per capita on pharmaceuticals and other non-durable medical care, more than double the OECD average of $515.[13]
Another explanation for increased costs is the rise of chronic diseases, including obesity. Nationally, health care costs for chronic diseases contribute huge proportions to health care costs, particularly during end of life care. “Patients with chronic illness in their last two years of life account for about 32% of total Medicare spending, much of it going toward physician and hospital fees associated with repeated hospitalizations.”[14] The National Academy of Sciences found that among other high-income nations the U.S. has a higher rate of chronic illness and a lower overall life expectancy. Their findings suggest that this holds true even when controlling for socio-economic disparity.[15] Experts are focusing more on preventative care in an effort to improve health and reduce the financial burdens associated with chronic disease.[16] One provision of the Patient Protection and Affordable Care Act, commonly referred to as simply the Affordable Care Act (ACA), implemented in 2013, provides additional Medicaid funding for states providing low cost access to preventative care.[17]
Finally, high administrative costs are a contributing factor to the inflated costs of U.S. health care. The U.S. leads all other industrialized countries in the share of national health care expenditures devoted to insurance administration. It is difficult to determine the exact differences between public and private administrative costs, in part because the definition of “administrative” varies widely. Further, the government outsources some of its administrative needs to private firms.[18] What is clear is that larger firms spend a smaller percentage of their total expenditures on administration, and nationwide estimates suggest that as much as half of the $361 billion spent annually on administrative costs is wasteful.[19] In January 2013, a national pilot program implemented under the ACA began. The aim is to improve administrative efficiency by allowing doctors and hospitals to bundle billing for an episode of care rather than the current ad hoc method.[20]
Health Insurance in the U.S.: Uneven Coverage
While the majority of U.S. citizens have health insurance, premiums are rising and the quality of the insurance policies is falling. Average annual premiums for family coverage increased 11 percent between 1999 and 2005, but have since leveled off to increase five percent per year between 2005 and 2015.[21] Deductibles are rising even faster. Between 2010 and 2015, single coverage deductibles have risen 67 percent.[22] These figures outpace both inflation and workers’ earnings.
The lack of health insurance coverage has a profound impact on the U.S. economy. The Center for American Progress estimated in 2009 that the lack of health insurance in the U.S. cost society between $124 billion and $248 billion per year. While the low end of the estimate represents just the cost of the shorter lifespans of those without insurance, the high end represents both the cost of shortened lifespans and the loss of productivity due to the reduced health of the uninsured.[23]
Health insurance coverage is uneven and often minorities and the poor are underserved. Forty million workers, nearly two out of every five, do not have access to paid sick leave. Experts suggest that the economic pressure to go to work even when sick can prolong pandemics, reduce productivity, and drive up health care costs.[24]
There were 32 million uninsured Americans in 2014, nine million fewer than the year prior. Experts attribute this sharp decline in the uninsured to the full implementation of the ACA in 2014.[25] Of American adults who had health insurance in 2014, 73 percent had one or more full-time workers in the family and 12 percent had one or more part-time workers in the family.[26] Just 49 percent of American adults reported getting health insurance from an employer in 2014.[27]
Coverage by employer-provided insurance varies considerably by wage level. Firms with higher proportions of low-wage workers are less likely to provide access to health insurance than those with low-proportions of low-wage workers.[28]
In 2014, 11.2 percent of full-time workers were without health insurance. However, the percentage of part-time workers without insurance was 17.7 percent, a significant decrease from 24 percent in 2013, thanks in part to the Affordable Care Act. The uninsured rate among those who had not worked at least one week also decreased from 22.2 percent in 2013 to 17.3 percent in 2014.[29]
Smaller firms are significantly less likely to provide health benefits to full or part-time workers. Among all small firms (3-199 workers) in 2015, only 56 percent offered health coverage, compared to 98 percent of large firms.[30]
After the Affordable Care Act allowed for many young adults (19-25) to remain on their parents’ health plans, there was a statistically significant increase in the percentage of insured young people from 68.3 percent in 2009[31] to 82.9 percent in 2014.[32] Over the same period, the percentage of young people aged 26-34 with insurance increased from 70.9 percent to 81.8 percent.[33]
Minorities and children are disproportionately uninsured. In 2014, 7.6 percent of non-Hispanic Whites were uninsured, 11.8 percent of Blacks were uninsured, 9.3 percent of Asians, and 19.9 percent of people of Hispanic origin were uninsured.[34] The Kaiser Family Foundation has found that about 80 percent of the uninsured are U.S. citizens.[35] Among children, six percent were uninsured in 2014.[36] These children are 10 times more likely than insured children to have unmet medical needs and are five times as likely as an insured child to go more than two years without seeing a doctor.[37]
Women in the individual market often faced higher premiums than men for the same coverage. Beginning in 2014, the Affordable Care Act banned this practice, as well as denying coverage for pre-existing conditions.[38]
In 2014, 19.3 percent of the population living below 100 percent of the poverty line ($23,550 a year for a family of four) was uninsured.[39] According to the Kaiser Family Foundation, 90 percent of the uninsured have family incomes within 400 percent of the federal poverty level. This makes them eligible for either subsidized coverage through tax credits or expanded Medicaid eligibility under the Affordable Care Act’s state health exchanges. [40]
Rising Healthcare Premiums
Health insurance premiums in the U.S. are rising fast. From 2005 to 2015, average annual health insurance premiums for family coverage increased 61 percent, while worker contributions to those plans increased 83 percent in the same period. This rate of increase outpaces both inflation and increases in workers’ wages.[41]
In 2005, the average annual premiums for employer-sponsored health insurance were $2,713 for single coverage and $8,167 for family coverage. In 2015, premiums more than doubled to $6,251 for employer-sponsored single coverage and $17,545 for employer-sponsored family coverage.[42]
A growing number of workers face a deductible of $1,000 or more for individual plans. In 2015, 46 percent (compared to 38 percent in 2013 and 22 percent in 2009) of workers were enrolled in a plan with an annual deductible of $1,000 or more. Employees at small firms are more likely than those at large firms to have a deductible greater than $1,000.[43]
The Union Difference: Union workers are more likely than their nonunion counterparts to be covered by health insurance and paid sick leave. In March 2015, 95 percent of union members in the civilian workforce had access to medical care benefits, compared with only 68 percent of nonunion members. In 2015, 85 percent of union members in the civilian workforce had access to paid sick leave compared to 62 percent of nonunion workers.[44] At the median, private-sector unionized workers pay 38 percent less for family coverage than private-sector nonunionized workers, according to a 2009 study.[45]
Across states, there are significant disparities in both the availability and the cost of health care coverage.
In 2012, Medicare reimbursements per enrollee varied from $6,724 in Anchorage, Alaska to $13,596 in Miami, Florida.[46] Annual premiums are similarly disparate. In 2015, the average family premium in the South was $16,785 while the same coverage averaged $18,096 in the Northeast.[47]
Firms in the South were less likely to provide coverage for an employee’s domestic partner than other regions. In the South, 41 percent of firms reported providing benefits for same-sex partners (compared to 51 percent in the Northeast) and 20 percent reported offering benefits to opposite-sex domestic partners (compared to 46 percent in the Northeast).[48]
High Costs Drive Americans into Bankruptcy
Universal coverage, in countries like the United Kingdom, Switzerland, Japan, and Germany makes the number of bankruptcies related to medical expenses negligible.[49] Conversely, a 2014 survey of bankruptcies filed between 2005 and 2013 found that medical bills are the single largest cause of consumer bankruptcy, with between 18 percent and 25 percent of cases directly prompted by medical debt.[50] Another survey found that in 2013, 56 million Americans under the age of 65 had trouble paying medical bills.[51] Another 10 million will face medical bills they are unable to pay despite having year-round insurance.[52]
It has been suggested, based on the experience of Massachusetts, where medical-related bankruptcies declined sharply after the state enacted its health reform law in 2006, that the ACA may help reduce such bankruptcies in the future.[53]
The Affordable Care Act: Successes and Remaining Challenges
In March, 2010, President Obama signed the ACA into law that made hundreds of significant changes to the U.S. healthcare system between 2011 and 2014. Provisions included in the ACA are intended to expand access to healthcare coverage, increase consumer protections, emphasizes prevention and wellness, and promote evidence- based treatment and administrative efficiency in an attempt to curb rising healthcare costs.
Beginning in January 2014, almost all Americans are required to have some form of health insurance from either their employer, an individual plan, or through a public program such as Medicaid or Medicare. Since the so-called “individual mandate” took effect, the total number of nonelderly uninsured adults dropped from 41 million in 2013 to 32.3 million in 2014.[54] The largest coverage gains were concentrated among low-income people, people of color, and young adults, all of whom had high uninsured rates prior to 2014.[55]
A major provision of the ACA was the creation of health insurance marketplace exchanges where individuals not already covered by an employer-provided plan or a program such as Medicaid or Medicare can shop for health insurance. Individuals with incomes between 100 percent and 400 percent of the federal poverty line would be eligible for advanceable premium tax credits to subsidize the cost of insurance. States have the option to create and administer their own exchanges or allow the federal government to do so. Currently, only 14 states operate their own exchanges.[56]
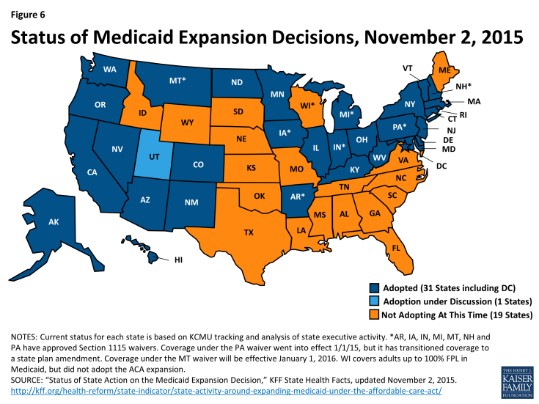
Designed to promote competition among providers and deliver choice transparency to consumers, the state-based exchanges appear to be doing just that. A recent analysis by the Commonwealth Fund found that the number of insurers offering health insurance coverage through the marketplaces increased from 2014 to 2015.[57] Additionally, there was generally no reported increase in average premiums for marketplace plans over that period. The analysis found only a modest increase in average premiums for the lowest cost plans from 2015 to 2016.[58]
The ACA also included a major expansion of the Medicaid program, although the Supreme Court ruled in 2012 that this expansion is a state option. As of November 2015, 30 states have chosen to expand Medicaid. As of 2014, adults with incomes at or below 138 percent of the federal poverty line are now eligible for Medicaid in the states that have adopted the expansion.[59]
Despite improvements to the U.S healthcare system under the ACA, a number of challenges remain. In 2014, 10.4 percent of Americans were still uninsured[60], and those with insurance still face high deductibles and premium costs. Furthermore, in the 20 states that had not expanded Medicaid, an estimated three million poor adults fall into the “coverage gap” where their incomes are above current Medicaid eligibility limits but below the lower limit of premium credits on the healthcare exchanges. The bulk of people in the coverage gap are concentrated in the South, with Texas (766,000 people), Florida (567,000), Georgia (305,000) and North Carolina (244,000) having among the highest number of uninsured.[61]
The ACA included a number of other provisions to improve healthcare access and affordability. The law banned lifetime monetary caps on insurance coverage for all new plans and prohibited plans from excluding children and most adults with preexisting conditions.[62] Insurance plans are also prohibited from cancelling coverage except in the case of fraud, and are required to rebate customers if they spend less than 85 percent (80 percent for individual and small group plans) of premiums on medical services. Additionally, the ACA established the Prevention and Public Health Fund to allocate $7 billion towards preventative care such as disease screenings, immunizations, and pre-natal care for pregnant women and between 2010 and 2015. Furthermore, $11 billion in funding for community health centers and $1.5 billion in additional funding for the National Health Service Corps was included in the law.[63]
A number of cost control provisions were included in the ACA in an attempt to curb rising medical costs. Among them is the Independent Payment Advisory Board, which will provide recommendations to Congress and the President for controlling Medicare costs if the costs exceed a target growth rate. The administrative process for billing, transferring funds, and determining eligibility is being simplified by allowing doctors to bundle billing for an episode of care rather than the current ad hoc method. Additionally, changes were made to the Medicare Advantage program that would provide bonuses to high rated plans, incentivizing these privately-operated plans to improve quality and efficiency. Furthermore, hospitals with high readmission rates will see a reduction in Medicare payments while a new Innovation Center within the Centers for Medicare and Medicaid Services was created to test new program expenditure reduction methods.[64]
Common Methods to Lower Health Care Costs
By taking an international perspective and looking to other advanced industrialized countries with nearly full coverage, much can be learned. While methods range widely, other OECD countries generally have more effective and equitable health care systems that control health care costs and protect vulnerable segments of the population from falling through the cracks. Among the OECD countries and other advanced industrialized countries, there are three main types of health insurance programs:
A national health service, where medical services are delivered via government-salaried physicians, in hospitals and clinics that are publicly owned and operated—financed by the government through tax payments. There are some private doctors but they have specific regulations on their medical practice and collect their fees from the government. The U.K., Spain, and New Zealand employ such a system. [65]
A national health insurance system, or single-payer system, in which a single government entity acts as the administrator to collect all health care fees, and pay out all health care costs. Medical services are publicly financed but not publicly provided. Canada, Denmark, Taiwan, and Sweden have single-payer systems.
A multi-payer health insurance system, or all-payer system, which provides universal health insurance via “sickness funds,” used to pay physicians and hospitals at uniform rates, thus eliminating the administrative costs for billing. This method is used in Germany, Japan, and France.[66]
A universal mandate for health care coverage defines these systems. Such a mandate eliminates the issue of paying the higher costs of the uninsured, especially for emergency services due to lack of preventative care.[67] Other methods for reducing costs may include:
Funding health care costs in relation to income rather than risk or people’s medical history.[68]
Negotiating the price of prescription drugs and bulk purchasing of prescription medications and durable medical equipment is a method used in other countries for lowering costs. This has been effectively used by the U.S. Department of Veterans Affairs, Medicaid, and Health Management Organizations in the U.S. Yet, it has been prohibited by law from traditional Medicare. Savings of up to five percent of total health care expenditures could result from the full adoption of these practices.[69]
An International Case Study: How Germany Pays for Health Care
Germany has one of the most successful health care systems in the world in terms of quality and cost. Some 240 insurance providers collectively make up its public option. Together, these non-profit “sickness funds” cover 90 percent of Germans, with the majority of the remaining 10 percent, generally higher income Germans, opting to pay for private health insurance. The average per-capita health care costs for this system are less than half of the cost in the U.S. The details of the system are instructive, as Germany does not rely on a centralized, Medicare-like health insurance plan, but rather relies on private, non-profit, or for-profit insurers that are tightly regulated to work toward socially desired ends—an option that might have more traction in the U.S. political environment.[70]
The average insurance contributions to German sickness funds are based on an employee’s gross income, around 15.5 percent with an income cap at $62,781, and employers and employees each pay about half of the premium. Generally, an individual employee’s contribution is 8.2 percent and the employer pays the remaining 7.3 percent.[71] [72]
Premiums are not based on risk and are not affected by a person’s marital status, family size, or health. Germans have no deductibles and low co-pays.[73]
Doctors are private entrepreneurs and get a fee from insurers for every visit and procedure they perform. However, they are tightly regulated. Groups of office-based physicians in every region negotiate with insurers to arrive at collective annual budgets. Doctors must remain in these budgets, as they do not receive additional funding if they go over. This helps keep health care costs in check and discourages unnecessarily expensive procedures. The average German doctor also makes about one-third less per year than in the U.S., around $123,000.[74]
Government general revenues cover premiums for children, on the premise that the next generation should be the entire nation’s fiscal responsibility, instead of just the responsibility of the parents.[75]
Germany reformed its coverage for prescription drugs in 2010 after costs for prescription drugs continued to rise. Prior to reforms, drug companies set the price for new drugs and were not required to show that the new drug was an improvement over previously available prescription drugs. Pursuant to the reforms effective in 2011, manufacturers could set the price for the first 12 months a new drug is on the market. “As soon as the drug enters the market, a new process of benefit assessment begins.” Manufacturers must establish, through comparative effective research that the new drug has an “added benefit to the patient, compared to the previously existing standard treatment.” Drugs without added benefit will be reimbursed according to a government pricing list. New drugs without added benefits are available to patients, but the patient has to pay the price difference. For drugs with added benefit, a price will be negotiated between health insurers and the manufacturer.[76]
Quality of U.S. Health Care in an International Context
U.S. health care specialists are among the best in the world. However, treatment in the U.S. is inequitable, overspecialized, and neglects primary and preventative care.[77] The end result of the U.S. approach to health care is poorer health in comparison to other advanced industrialized nations. According to the Commonwealth Fund Commission, in a 2014 comparison with Australia, Canada, France, Germany, the Netherlands, New Zealand, Norway, Sweden, Switzerland, the U.K., the U.S. ranked last overall. In terms of quality of care, the U.S. ranked fifth, but came in last place in efficiency, equity, and healthiness of citizens’ lives.[78]Comparing other health care indicators in an international context underscores the dysfunction of the U.S. health care system.
Despite the relatively high level of health expenditure, in the U.S. there are fewer physicians per capita than in most other OECD countries. In 2013, the U.S. had 2.6 practicing physicians per 1,000 people—below the OECD average of 3.3.[79]
In the U.S., there are only about 1.2 primary care physicians per 1,000 people. Projections indicate that the U.S. will need 52,000 more primary care physicians by 2025 to meet demand.[80] While population growth and aging make up a substantial proportion of this increased need, expanded access to insurance under the Affordable Care Act means more people will seek out treatment. Therefore, there are provisions in the legislation to increase the number of primary care physicians in the U.S.
There is a significant spatial mismatch within the United States for physicians as well. While the U.S. averaged 225.6 doctors active in patient care per 100,000 people in 2014, there is a wide variance across states; Massachusetts ranks highest with 349.5 active doctors per 100,000 people, while Mississippi has only 170.3.[81]
In 2013, the U.S. infant mortality rate was 5.96 per 1,000 live births[82], while the OECD median was 3.8.[83]
The obesity rate among adults in the U.S. was 35.3 percent in 2013, down slightly from 36.5 in 2011. This is the highest rate among OECD countries. The average for the OECD countries was 19.0 percent in 2013.[84]
Related reading:
Interested in learning about the impact unionizing can have on health care benefits?
I'm a Professional. What can a union do for me?
The Union Difference for Working Professionals
Interested in learning more about challenges for health care professionals?
Safe Staffing: Critical for Patients and Nurses.
August 2016
[1] “National Health Expenditures 2014 Highlights” Center for Medicare and Medicaid Services. Available at: https://www.cms.gov/research-statistics-data-and-systems/statistics-trends-and-reports/nationalhealthexpenddata/nationalhealthaccountshistorical.html
[2] Jessica C. Smith and Carla Medalia, U.S. Census Bureau. Current Population Reports, pg 5 Health Insurance Coverage in the United States: 2014, U.S. Government Printing Office, Washington, DC, 2015.
[3] OECD (2015), Health at a Glance 2015: OECD Indicators, OECD Publishing. Available at: http://www.oecd-ilibrary.org/social-issues-migration-health/health-at-a-glance_19991312
[4] OECD (2015), Health at a Glance 2015: OECD Indicators, OECD Publishing. Available at: http://www.oecd-ilibrary.org/social-issues-migration-health/health-at-a-glance_19991312
[5] Ibid.
[6] Ibid.
[7] Chart source: OECD (2015), Health at a Glance 2015: OECD Indicators, OECD Publishing. Available at: http://www.oecd-ilibrary.org/social-issues-migration-health/health-at-a-glance_19991312
[8] Ibid.
[9] Karen Davis, Kristof Stremikis, David Squires, and Cathy Schoen “Mirror, Mirror on the Wall: How the Performance of the U.S. Health Care System Compares Internationally, 2014 Update,” The Commonwealth Fund Commission on a High Performance Health System, June, 2014, 11. Available at: http://www.commonwealthfund.org/~/media/files/publications/fund-report/2014/jun/1755_davis_mirror_mirror_2014.pdf
[10] Ibid.
[11] U.S. Department of Health & Human Services, Health System Measurement Project, “Percentage of People Who Did Not Receive or Delayed Needed Care Due to Cost in the Past 12 Months.” Available at: https://healthmeasures.aspe.hhs.gov/measure/282
[12] Adara Beamesderfer and Usha Ranji. “U.S. Health Care Costs.” Background Brief. Kaiser Family Foundation. February 2012.
[13] OECD (2015), Health at a Glance 2015: OECD Indicators, OECD Publishing. Pg 31. Available at: http://www.oecd-ilibrary.org/social-issues-migration-health/health-at-a-glance_19991312
[14] The Dartmouth Atlas of Health Care. “End of Life Care”. 2013. Available at: http://www.dartmouthatlas.org/keyissues/issue.aspx?con=2944
[15] National Research Council. U.S. Health in International Perspective: Shorter Lives, Poorer Health. Washington, DC: The National Academies Press, 2013.
[16] Adara Beamesderfer and Usha Ranji. “U.S. Health Care Costs.” Background Brief. Kaiser Family Foundation. February 2012.
[17] “Key Features of the Affordable Care Act, By Year.” U.S. Department of Health and Human Services. Washington, D.C. Available at: http://www.hhs.gov/healthcare/about-the-law/preventive-care/index.html
[18] Ezra Kelin. “Administrative Costs in Healthcare: A Primer”. The Washington Post. July 7, 2009. Available at: http://voices.washingtonpost.com/ezra-klein/2009/07/administrative_costs_in_health.html
[19] Ibid.; Elizabeth Winkler, Peter Basch, and David Cutler. “Paper Cuts: Reducing Health Care Administrative Costs”. Center for American Progress. June 2012. Available at: http://www.americanprogress.org/wp-content/uploads/issues/2012/06/pdf/papercuts_final.pdf
[20] “Key Features of the Affordable Care Act, By Year.” U.S. Department of Health and Human Services. Washington, D.C. Available at: http://www.healthcare.gov/law/timeline/full.html
[21] Michelle Long, Matthew Rae, Gary Claxton; Anne Jankiewicz; David Rousseau, “Recent Trends in Employer-Sponsored Health Insurance Premiums” Journal of the American Medical Association. January 5, 2016. Available at: http://jama.jamanetwork.com/article.aspx?articleid=2480470
[22] Ibid.
[23] Peter Harbage, Ben Furnas, “The Cost of Doing Nothing on Health Care,” Center for American Progress, 2009. Available at: http://www.americanprogress.org/issues/2009/05/pdf/cost_doing_nothing.pdf
[24] “Everyone Gets Sick. Not everyone has time to get better: A briefing book on establishing a paid sick leave standard.” National Partnership for Women and Families, July 2011. Available at: http://www.nationalpartnership.org/site/DocServer/PSD_Briefing_Book.pdf
[25] Melissa Majerol, Vann Kewkirk, and Rachel Garfield, “The Uninsured: A Primer – Key Facts About Health Insurance and The Uninsured in the Era of Health Reform”, Kaiser Family Foundation, November 2015. Available at: http://kff.org/uninsured/report/the-uninsured-a-primer-key-facts-about-health-insurance-and-the-uninsured-in-the-era-of-health-reform/
[26] Kaiser Family Foundation, “Key Facts About the Uninsured Population,” 2015.
[27] Kaiser Family Foundation, “Health Insurance Coverage of the Total Population.”2014. Available at: http://kff.org/other/state-indicator/total-population/
[28] Employer Health Benefits 2015 Annual Survey,” Kaiser Family Foundation, 2015. Available at: http://kff.org/report-section/ehbs-2015-section-two-health-benefits-offer-rates/
[29] By Jessica C. Smith and Carla Medalia, U.S. Census Bureau. Current Population Reports, Health Insurance Coverage in the United States: 2014, pg 10 U.S. Government Printing Office, Washington, DC, 2015.
[30] Employer Health Benefits 2015 Annual Survey,” Kaiser Family Foundation, 2015. Available at: http://kff.org/report-section/ehbs-2015-section-two-health-benefits-offer-rates/
[31] Carmen DeNavas, Bernadette D. Proctor, Jessica C. Smith. U.S. Census Bureau. Current Population Reports
Income, Poverty, and Health Insurance Coverage in the United States: 2009 pg 25 U.S. Government Printing Office, Washington, DC, 2010. Available at: https://www.census.gov/library/publications/2010/demo/p60-238.html
[32] By Jessica C. Smith and Carla Medalia, U.S. Census Bureau. Current Population Reports, Health Insurance Coverage in the United States: 2014, pg 7 U.S. Government Printing Office, Washington, DC, 2015.
[33] Ibid.
[34] By Jessica C. Smith and Carla Medalia, U.S. Census Bureau. Current Population Reports, Health Insurance Coverage in the United States: 2014, pg 15 U.S. Government Printing Office, Washington, DC, 2015.
[35] “The Uninsured and the Difference Health Insurance Makes,” Kaiser Family Foundation, September 2010, 1. Available at: http://www.kff.org/uninsured/upload/1420-12.pdf
[36] Kaiser Family Foundation, “Health Insurance Coverage of Children 0-18” State Health Facts. 2014. Available at: http://kff.org/other/state-indicator/children-0-18/
[37] “Policy Priorities: Uninsured Children,” Children’s Defense Fund, 2009. Available at: http://www.childrensdefense.org/policy-priorities/childrens-health/uninsured-children/
[38] “Women and Health Care in the United States.” National Women’s Law Center, May, 2013. Washington, D.C. Available at: http://www.nwlc.org/sites/default/files/pdfs/2012aca-factsheets/us_062012healthstateprofiles.pdf
[39] By Jessica C. Smith and Carla Medalia, U.S. Census Bureau. Current Population Reports, Health Insurance Coverage in the United States: 2014, pg 13. U.S. Government Printing Office, Washington, DC, 2015.
[40] “The Uninsured and The Difference Health Insurance Makes,” Kaiser Family Foundation, September 2012, 1. Available at: http://kff.org/health-reform/fact-sheet/the-uninsured-and-the-difference-health-insurance/
[41] Employer Health Benefits 2015 Annual Survey,” Kaiser Family Foundation, 2015. Available at: http://kff.org/report-section/ehbs-2015-section-two-health-benefits-offer-rates/
[42] Ibid.
[43] Ibid.
[44] U.S. Department of Labor, Bureau of Labor Statistics. Employee Benefits in the United States, Table 2 and Table 6; March 2015. Available at: http://www.bls.gov/news.release/pdf/ebs2.pdf
[45] Jenifer MacGillvary, “Family-Friendly Workplaces: Do Unions Make a Difference?” UC Berkley Labor Center, July 2009. Available at: http://laborcenter.berkeley.edu/jobquality/familyfriendly09.pdf
[46] “Total Medicare Reimbursements per Enrollee”. The Dartmouth Atlas of Health Care. Lebanon, NH. 2013. Available at: http://www.dartmouthatlas.org/data/table.aspx?ind=225&loct=3&tf=34&ch=191
[47] Employer Health Benefits 2015 Annual Survey,” Kaiser Family Foundation, 2015, 26. Available at: http://files.kff.org/attachment/report-2015-employer-health-benefits-survey
[48] Ibid.
[49] Battista M.D., John R. “An International Perspective on Health Care Reform,” Grand Rounds, Department of Medicine, Stamford Hospital, Stamford, CT, October 8, 2008. Available at: http://www.pnhp.org/news/2009/january/an-international-perspective-on-health-care-reform; Sarah Arnquist, “Health Care Abroad: Japan,” New York Times, August 25, 2009. Available at: http://prescriptions.blogs.nytimes.com/2009/08/25/health-care-abroad-japan/
[50] Austin, Daniel A. “Medical Debt as a Cause of Consumer Bankruptcy”, Maine Law Review, Vol 67, No. 1 pp 1-23 (2014). Retrieved from: http://papers.ssrn.com/sol3/papers.cfm?abstract_id=2515321
[51] Christina Lamontage, “Nerdwallet Health finds Medical Bankruptcy Accounts for Majority of Personal Bankruptcies” Nerdwallet. June 19, 2013.
[52] Ibid.
[53] Stech, Katy “The Future of Personal Bankrupcty in a Post-Obamacare World” The Wall Street Journal. July 1, 2015. Retrived from: http://blogs.wsj.com/bankruptcy/2015/07/01/the-future-of-personal-bankruptcy-in-a-post-obamacare-world/
[54] Melissa Majerol, Vann Kewkirk, and Rachel Garfield, “The Uninsured: A Primer – Key Facts About Health Insurance and The Uninsured in the Era of Health Reform”, Kaiser Family Foundation, November 2015. Available at: http://kff.org/uninsured/report/the-uninsured-a-primer-key-facts-about-health-insurance-and-the-uninsured-in-the-era-of-health-reform/
[55] Ibid.
[56] “State Health Insurance Exchange: State Run Exchanges”, ObamacareFacts.com. Available at: http://obamacarefacts.com/state-health-insurance-exchange/
[57] Davis Cusano and Kevin Lucia, “Implementing the Affordable Care Act: Promoting Competition in the Individual Marketplaces” The Common Wealth Fund, February 4, 2016. Available at: http://www.commonwealthfund.org/publications/issue-briefs/2016/feb/aca-competition-individual-marketplaces
[58] Ibid.
[59] Melissa Majerol, Vann Kewkirk, and Rachel Garfield, “The Uninsured: A Primer – Key Facts About Health Insurance and The Uninsured in the Era of Health Reform”, Kaiser Family Foundation, November 2015. Available at: http://kff.org/uninsured/report/the-uninsured-a-primer-key-facts-about-health-insurance-and-the-uninsured-in-the-era-of-health-reform/
[60] Ibid.
[61] Ibid.
[62] “The Affordable Care Act: A Brief Summary”, National Conference of State Legislatures, March 2011. Available at: http://www.ncsl.org/research/health/the-affordable-care-act-brief-summary.aspx
[63] “Summary of the Affordable Care Act”, The Kaiser Family Foundation. April 25, 2013. Available at: http://kff.org/health-reform/fact-sheet/summary-of-the-affordable-care-act/
[64] Ibid.
[65] “Health Care Systems—Four Basic Models,” Physicians for a National Health Program, December 2008. Available at: http://www.pnhp.org/single_payer_resources/health_care_systems_four_basic_models.php
[66] Ibid.
[67] Battista, “An International Perspective on Health Care Reform.”
[68] Ibid.
[69] Ibid.
[70] Richard Knox, “Most Patients Happy With German Health Care,” NPR, August 5, 2009. Available at: http://www.npr.org/templates/story/story.php?storyId=91971406; Uwe Rienhart, “Health Reform Without a Public Plan: The German Model,” New York Times, April 17, 2009. http://economix.blogs.nytimes.com/2009/04/17/health-reform-without-a-public-plan-the-german-model/.
[71] Frequently Asked Questions About Health Care Coverage In Germany,” American Voices Abroad Berlin, 2009. Available at: http://americanviewsabroad.org/FAQs_about_healthcare_in_Germany_v4.pdf
[72] Elias Mossialos, Martin Wenzl, Robin Osborn and Chloe Anderson “ International Profiles of Healthcare Systems, 2014” The Commonwealth Fund. January 2015. Available at: http://www.commonwealthfund.org/~/media/files/publications/fundreport/2015/jan/1802_mossialos_intl_profiles_2014_v7.pdf?la=en
[73] Ibid.
[74] Richard Knox, “Most Patients Happy With German Health Care.” Richard Knox, “Keeping German Doctors On A Budget Lowers Costs,” NPR, July 2, 2008. Available at: http://www.npr.org/templates/story/story.php?storyId=91931036
[75] Uwe Rienhart, “Health Reform Without a Public Plan: The German Model.”
[76] Daniel Bahr and Thomas Huelskoetter, “Comparing the Effectiveness of Prescription Drugs: The German Experience,” Center for American Progress, May 21, 2014.
[77] James S. Cox, “The Future of Health Care,” MD News, August 29, 2011.Available at: http://www.mdnews.com/news/2011_08/05708_foh2011_the-future-of-health-care
[78] Davis,et. al. “Mirror, Mirror on the Wall: How the Performance of the U.S. Health Care System Compares Internationally, V.
[79] OECD (2015), Health at a Glance 2015: OECD Indicators, OECD Publishing. Available at: http://www.oecd-ilibrary.org/social-issues-migration-health/health-at-a-glance_19991312
[80] Petterson S et al. “Projecting US Primary Care Physician Workforce Needs: 2010-2025.”
Annals of Family Medicine, Vol. 10, No. 6, 503-509; 2012.
[81] “2015 State Physician Workforce Data Book” Association of American Medical Colleges, Washington, D.C. 2015. Available at: https://www.aamc.org/data/workforce/reports/442830/statedataandreports.html
[82] “Deaths: Final Data for 2013”, The Centers for Disease Control and Prevention, National Vital Statistics Reports. Vol 64, No. 2. February 16, 2016. Available at: http://www.cdc.gov/nchs/fastats/infant-health.htm
[83] OECD (2015), Health at a Glance 2015: OECD Indicators, OECD Publishing. Available at: http://www.oecd-ilibrary.org/social-issues-migration-health/health-at-a-glance_19991312
[84] Ibid.